Skip to content


- Bitcoin’s price remains volatile in the short term, but institutional adoption suggests strong long-term growth.
- Holding support at $107,500, Bitcoin could target $117,000, $124,000, and $129,300 if momentum continues.
- RSI at 48.53 shows neutral market conditions, while MACD signals potential bearish movement for Bitcoin.
Bitcoin price will continue to fluctuate in the short run because of the market and regulatory changes. Nevertheless, it has strong long-term growth prospects since institutional use is still growing. Analysts forecast that Bitcoin may undergo positive and negative fluctuations with potential profits in case the positive situation continues to dominate.
Bitcoin (BTC) is currently trading at $112,169, representing a 1.15% increase over the past day. The trading volume is down by 17.3 percent and is currently at $47.82 billion. Bitcoin has increased by 1.93% over the past week, although the trading activity was reduced.
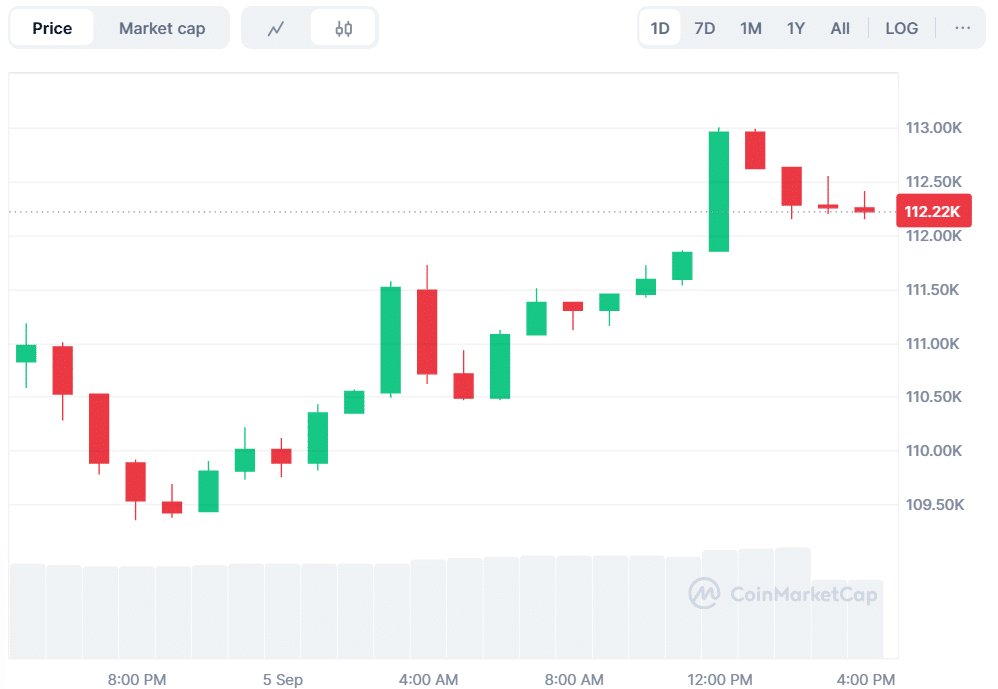
Source: CoinMarketCap
Bitcoin’s Next Move Hinges on Strong Support Level
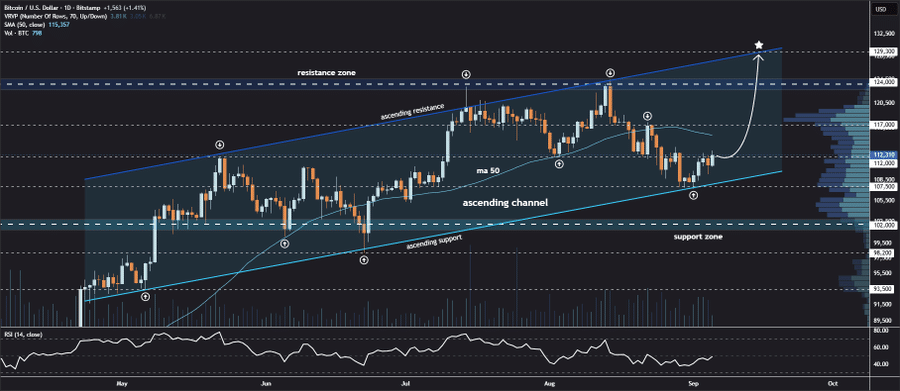
Analyst Jonathan Carter highlighted that Bitcoin is holding on to an important support at 107,500. The level belongs to an upward trend that Bitcoin has been on. Bitcoin might continue to record increased profits so long as this support persists.
It has price targets of $117,000, $124,000, and $129,300. Nonetheless, when Bitcoin breaks the support level and goes down, it might hit the $102,000 area. This would give an indication of a probable decline, and investors would have to monitor the price.
Source: X
Also Read: Solana Holdings Surge as DeFi Development Corp Expands Treasury to $371M
Another analyst, The Crypto Express, has mentioned that Bitcoin is currently in a symmetrical triangle. The cryptocurrency just broke out of its support trendline. BTC might escape this pattern due to the solid support of the Ichimoku Cloud.
A breakout would probably affirm a bullish trend and drive the prices of BTC even higher within the short run. This breakout is one of the signals that traders are monitoring to determine the future direction.

Source: X
Neutral RSI and Bearish MACD Indicate Possible Decline
RSI (Relative Strength Index) stands at a value of 48.53, which reflects a neutral market situation. At this point, BTC is neither oversold nor overbought. The MACD (Moving Average Convergence Divergence) indicates a bearish pattern whereby the MACD line stood at 101 and the signal line at -1,377. This movement is an indication that the Bitcoin trend can experience a decline soon.

Source: TradingView
Macro market trends and investor sentiment significantly influence the price movement of Bitcoin. Changes in market conditions will remain unpredictable, making it essential for traders to stay updated.
Also Read: Stablecoin Governance Push: Mega Matrix Files $2 Billion Shelf Registration with SEC