 Skip to content


- Polkadot (DOT) faces downward pressure with a 2% price decline, but trading volume has risen by 9.69%.
- Analysts suggest that DOT is holding strong at key support, with a breakout potential in the coming months.
- With an RSI of 32.57, DOT may be oversold, signaling a possible reversal if buying pressure increases.
Polkadot (DOT) is currently trading at $2.92, which is a 2% decline in the past 24 hours. The cryptocurrency is undergoing downward pressure, but its trading volume has increased by 9.69% and now stands at $410.11 million. This volume keeps rising, implying more investor activity even when the price is falling.
During the last week, the DOT price dropped by a strong 26%. This steep decline is indicative of the volatility of the cryptocurrency market. Such a sudden change in prices places investors at crossroads with the market. Despite the downturn, traders remain optimistic about a potential recovery while continuing to observe the price trends closely.
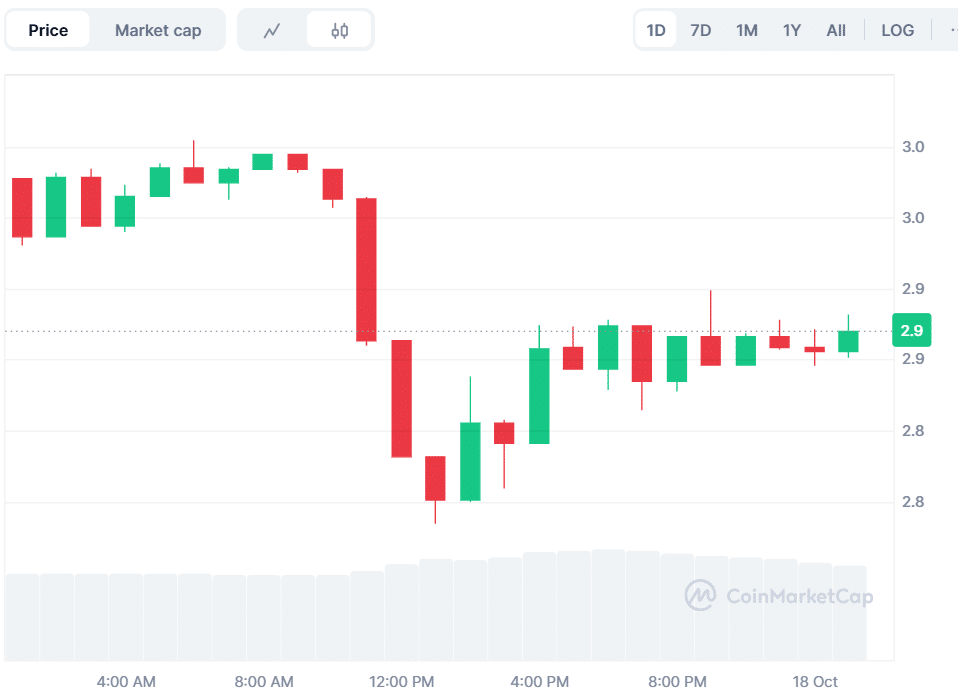
Source: CoinMarketCap
DOT Holds Key Support, Breakout Imminent
Jonathan Carter, a well-known analyst, highlighted that Polkadot (DOT) is currently positioned at the bottom of its lower wedge boundary on the weekly chart. He indicated that the price is respecting this major support zone, which might be an indication of signs of early reversal. The current compression in the market is not permanent, and there is speculation that a breakout can soon take place.
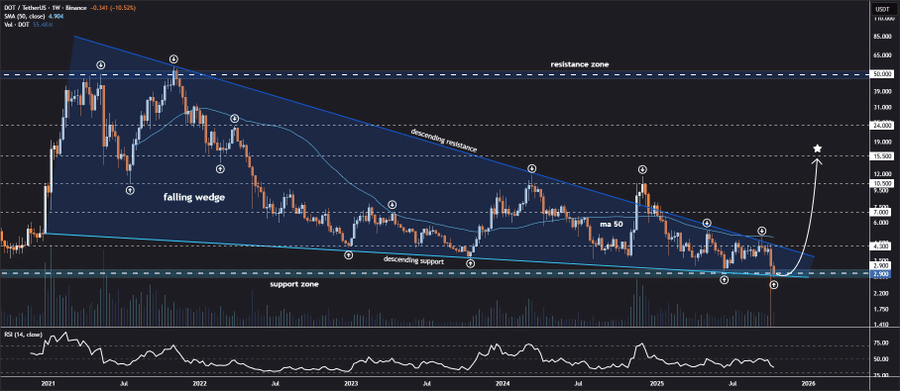
Source: X
Analysts have set price targets of DOT at $4.30, $7.00, $10.50, and even $15.50. These levels may be achieved within the next few months unless the support fails to hold. The tightening range implies that DOT may be about to take a drastic action, either too high or too low, in the near future.
Also Read: Crypto Fundraising Hits $19B in 2025, October’s $2.5B Investment Sparks Growth
RSI and MACD Indicate Bearish Sentiment for DOT
The Relative Strength Index (RSI) stands at 32.57, showing that DOT can be oversold. When the buying pressure grows, the low value of the RSI indicates that the cryptocurrency may be prepared to reverse. RSI has continued to decline in recent times, which indicates that the selling pressure is high.
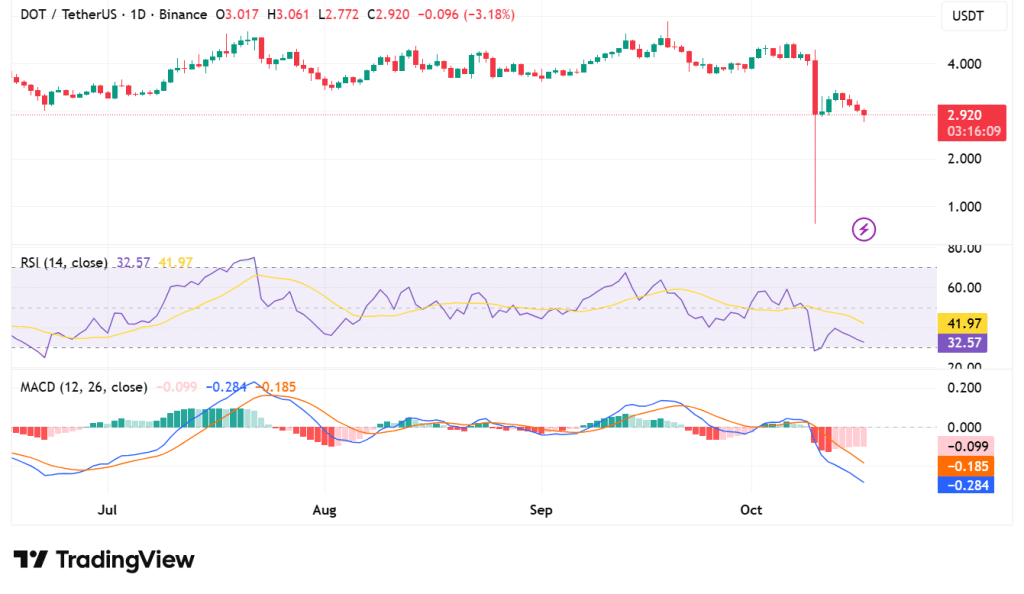
Source: TradingView
Moving Average Convergence Divergence (MACD) also indicates a downward trend. The MACD line is at -0.099, and the signal line is at -0.284. This signifies a further decline, as the difference between the two curves reveals that the market trend is negative.
Trading Volume Increases, But Open Interest Drops
According to CoinGlass data, the trading volume grew by 11.52% to $657.69 million. Open Interest has dropped 7.07% to 256.48 million. The DOT OI-Weighted Funding Rate stands at -0.0172%, indicating a bearish market mood. Despite this pressure, investors await indicators of a potential turnaround.
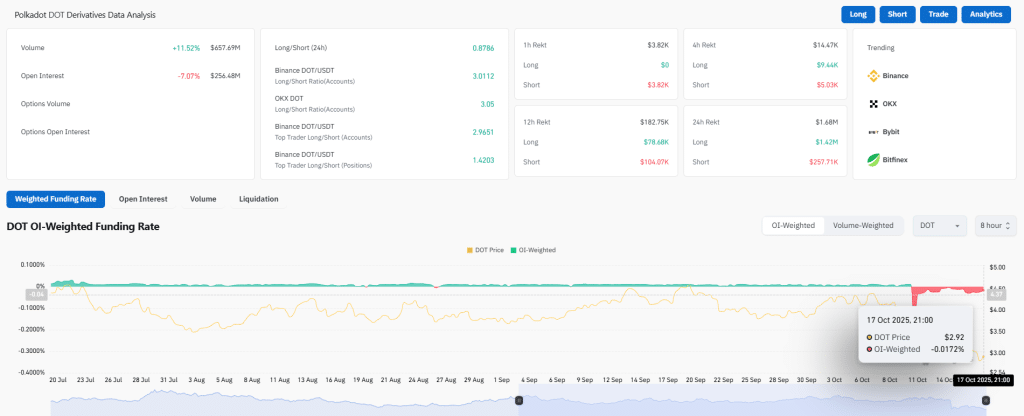
Source: CoinGlass
Also Read: North Korea Leverages Blockchain for Undetectable Cyberattacks on Job Seekers


