Skip to content


- Ethereum’s 50-day moving average has crossed above the 200-day, forming a bullish golden cross and hinting at a breakout above $2,000.
- Analysts compare Ethereum’s current structure to Bitcoin’s 2020 cycle, with potential long-term targets between $6,000 and $8,000.
- Dormancy Flow, an on-chain data metric, signals that ETH may be undervalued and shows alignment with accumulation phases that precede major rallies.
Ethereum (ETH), the second-largest cryptocurrency by market capitalization, has posted a 9.9% gain over the past week, rekindling bullish sentiment among traders and analysts alike. Technical indicators and on-chain metrics are now aligning to suggest that the digital asset may be preparing for a significant breakout.
The spotlight is currently on a classic technical indicator flashing on Ethereum’s daily chart: a golden cross. As shared by prominent market analyst Titan of Crypto in a recent post on X (formerly Twitter), ETH’s 50-day moving average has crossed above its 200-day moving average, forming what is widely considered a bullish chart pattern.
Historically, a golden cross signals a potential trend reversal from bearish to bullish. People often see it as a precursor to sustained price rallies. In this case, the crossover suggests Ethereum could soon retest and possibly break above the psychologically significant $2,000 resistance level.
A chart shared by Titan highlights the momentum: the upward-sloping red line (50-day MA) slicing through the downward-sloping blue line (200-day MA). If this technical trend holds, ETH could be entering a new bullish phase.
Bull Flag Breakout Signals Ethereum Could Reach 8000
Supporting this view, analyst JJcycles shared a compelling comparison between Ethereum’s current structure and Bitcoin’s price action following the 2020 COVID-19 crash. According to JJcycles, Ethereum may now be trading near the bottom of its macro range, akin to Bitcoin’s positioning around $5,000 before its dramatic run-up.
This suggests ETH could be in the early stages of a long-term uptrend, especially as the broader market looks toward the next crypto bull cycle.
Further fueling optimism, trading account Bitcoinsensus identified a bull flag pattern on Ethereum’s monthly chart, a formation typically indicative of a continuation pattern in an ongoing uptrend. Currently, ETH is hovering near the lower boundary of this flag, with a potential breakout target as high as $8,000 if the pattern plays out.
Similarly, crypto strategist TraderPA views Ethereum as undergoing a reaccumulation phase, predicting a surge to $6,000 before the end of 2025.
Ethereum On-Chain Data Signals Market Bottom
Backing these technical forecasts, on-chain data also reveals a bullish undertone. Analyst Ali Martinez highlighted that Ethereum’s Entity-Adjusted Dormancy Flow, a metric used to assess the age of coins being moved, has dipped below 1 million. Historically, this level has coincided with market bottoms and undervaluation phases.
Despite the bullish narrative, not all signals are green. Ethereum’s recent price weakness and repeated failures to hold key support zones have kept bearish scenarios on the table. Some analysts warn that a retest of the $1,200 level remains a possibility if momentum fades or macroeconomic conditions deteriorate.
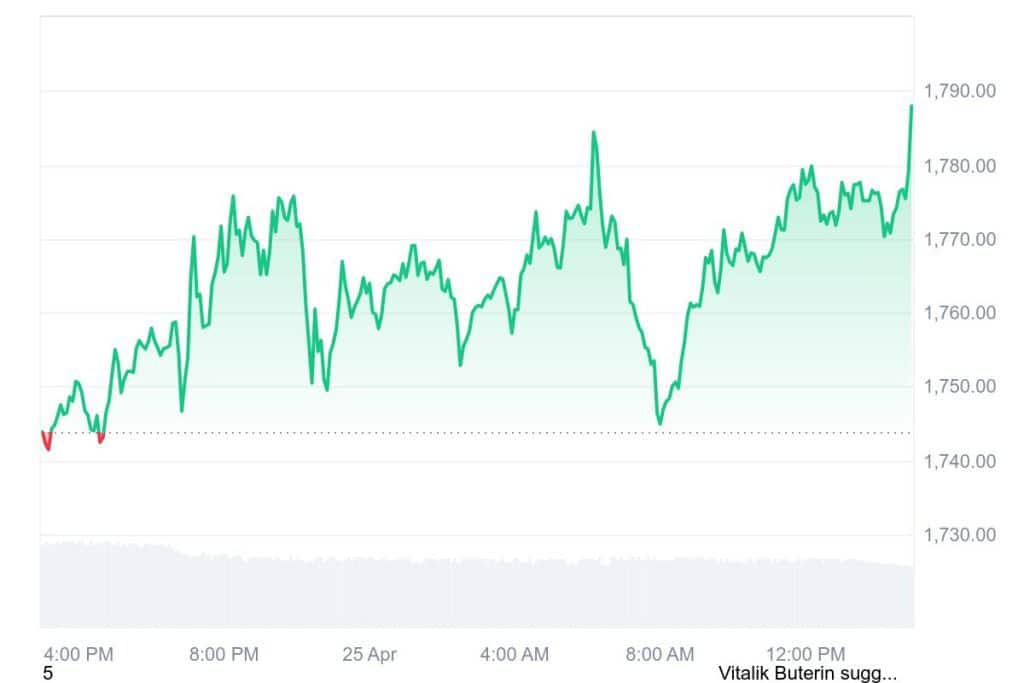
As of writing, Ethereum is trading at $ 1,787.96 with a 24-hour trading volume of $ 15.33B and a market cap of $ 215.59B. The ETH price increased by 2.50% in the last 24 hours. However, if current patterns hold and bullish momentum continues into Q2 2025, Ethereum could be on track not only to reclaim the $2,000 level but to set a new all-time high by year’s end.
Related | Metaplanet Buys 145 BTC Reaches 5000 Total and Races Toward 10000