 Skip to content


- Ethereum holds $4,365 with a daily gain of 0.71% as volume jumps 15.73% to $38.96 billion.
- Strong support lies at $3,850 and $3,900 holding this zone could open the path toward $6,000.
- RSI shows neutral momentum at 52.13, while MACD signals mild bearish pressure with reversal risk.
Ethereum (ETH) is currently trading at $4,365, marking a 0.71% increase in the past 24 hours. The trading activity is still quite robust, with volume going up by 15.73% and currently at $38.96 billion. Market sentiment is positive as short-term momentum picks up.
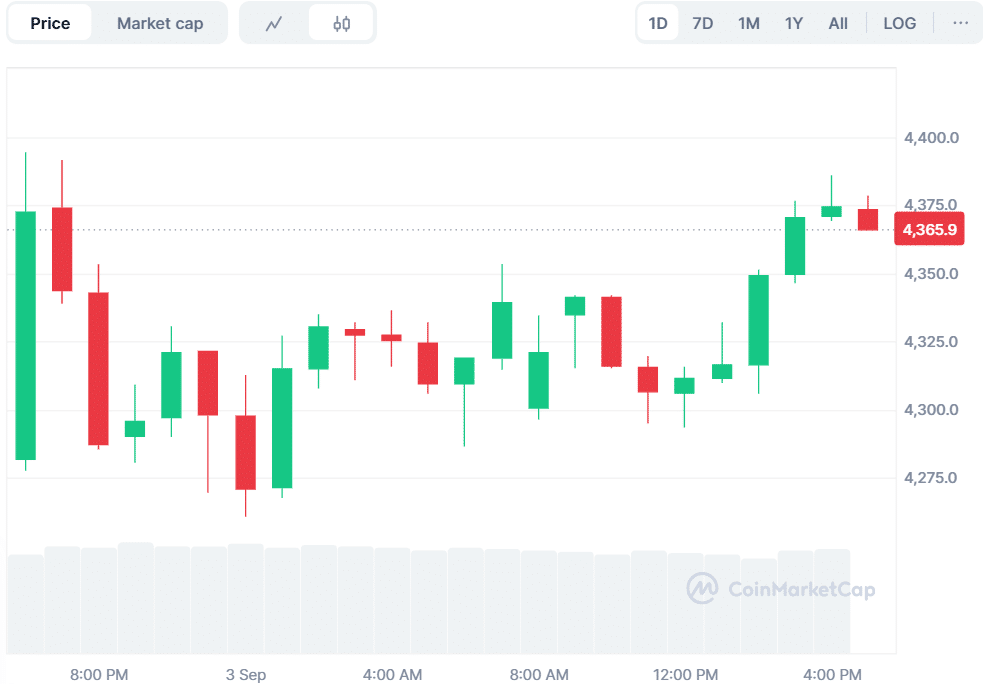
Source: CoinMarketCap
Over the last seven days, ETH has demonstrated a distinct trend. The value of the coin fell by 5.27%, showing pressure despite daily gains. Investors have been watching the recent corrections closely and remain optimistic for the future.
Ethereum’s Re-Accumulation Points to Fresh Momentum
Analyst Captain Faibik highlighted that Ethereum is trading in a rising channel on the 12-hour chart. He explained that there is a re-accumulation pattern after the recent peak. The strong support zone is now $3,850 to $3,900. He pointed out that bulls have to defend this level to keep market momentum going.
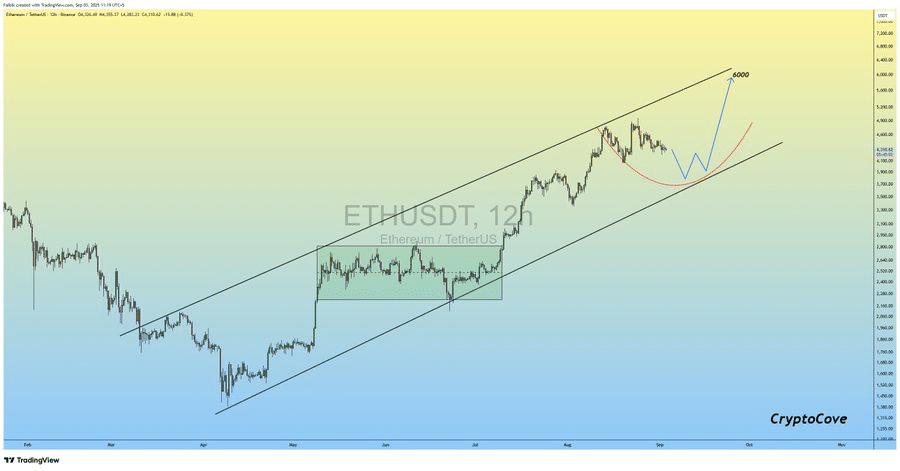
Source: X
He further added that a successful defense preserves the bullish structure. If buyers can maintain this level, ETH may target $6,000 in the next few weeks. His perspective is that the uptrend is not over and that it will continue.
Additionally, another analyst, Dollarcurrency21, mentioned the significance of the $4,000 level. He said this price maintains the bullish momentum. The Ichimoku Kumo cloud is a great structural support. If volume increases, his target is $6,200-$6,500. He referred to short-term corrections as buy opportunities prior to a breakout.
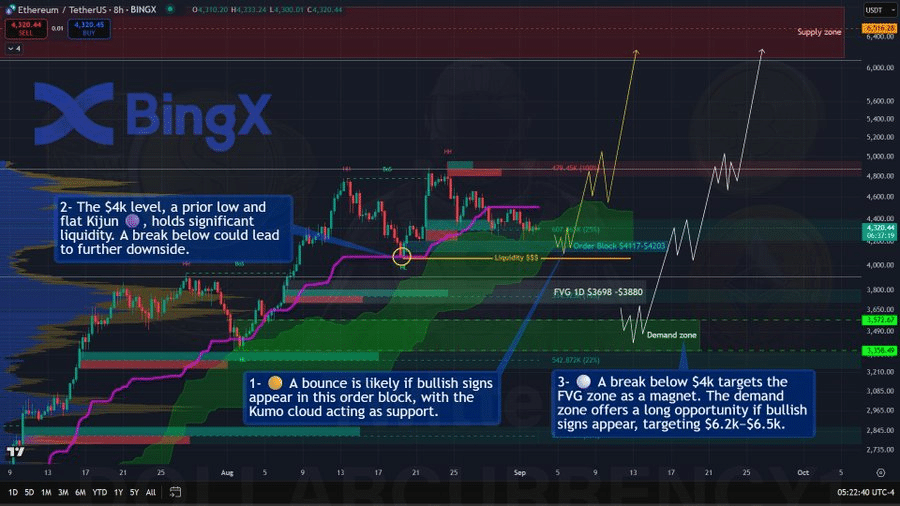
Source: X
Also Read: ONDO Market Activity Soars: Is a Sharp Upward Move Brewing?
RSI Neutral, MACD Warns of Pressure Ahead
The Relative Strength Index (RSI 14) is 52.13. The signal line is at 56.19. These levels correspond to a neutral market. ETH is neither overbought nor oversold. A break above 60 will confirm new bullish momentum. A drop below 45 may signal additional downside risk.
The Moving Average Convergence Divergence (MACD 12, 26) is issuing a warning. The MACD line is located at 89.2, while the signal line appears above it at 147.0. The histogram is negative at -57.8. This confirms mild bearish pressure. Analysts point out that a crossover can reverse momentum. Such a move can follow bullish continuation patterns.
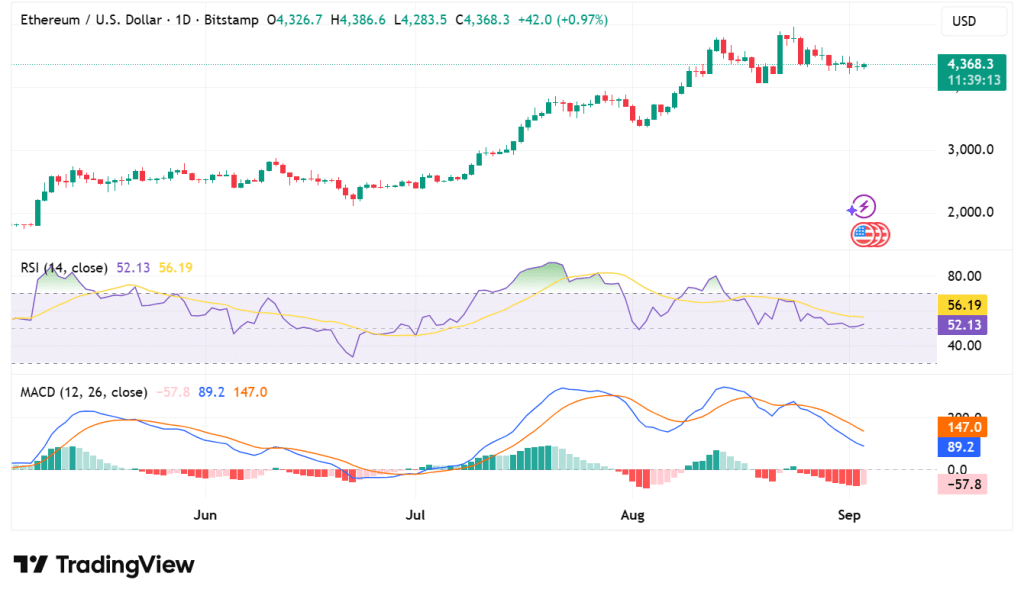
Source: TradingView
Ethereum maintains its trade above $4,300. Bullish support zones are still intact after weekly losses. Analysts believe that the next major move will be determined by volume strength. Traders still watch for the $3,900 pivot zone. A continuation hold could push prices to $6,000 and higher.
Also Read: Dogecoin Treasury Strategy: CleanCore Secures $175M Investment Backed by Foundation


