 Skip to content


- JASMY drops 11.86% in a week as selling pressure builds and investor sentiment weakens.
- RSI is at 43.60 with negative MACD, signaling weak momentum and an ongoing bearish market trend.
- A breakout above $0.0148 may flip the 100-day MA to support and trigger bullish recovery targets.
JasmyCoin (JASMY) is currently trading at $0.01464, showing a 0.22% loss over the last 24 hours. The trading volume has declined by 13.92% and currently is at $16.93 million. These signals indicate decreased market activity in the short run.
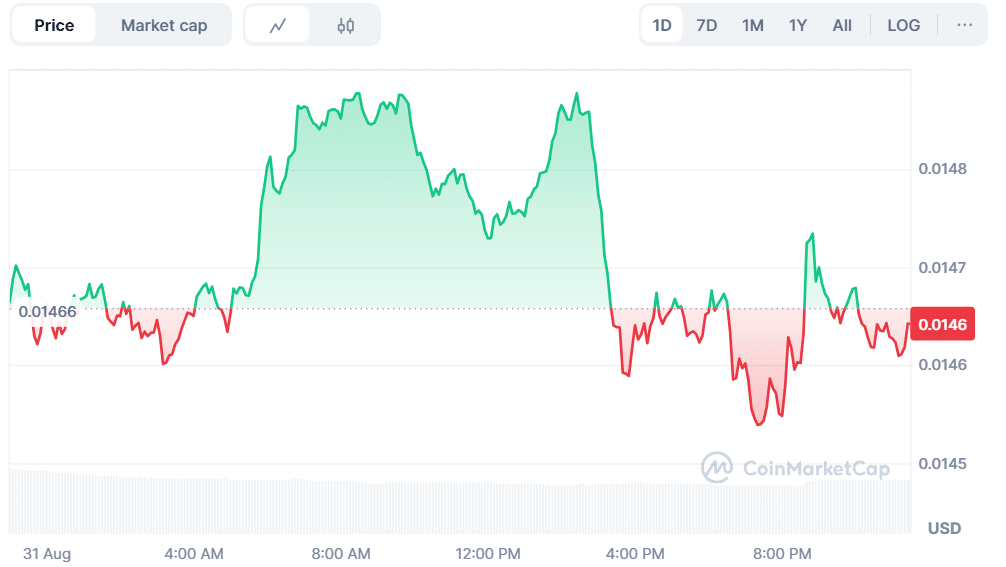
Source: CoinMarketCap
The price of JASMY has fallen by 11.86% over the past 7 days, indicating a significant negative trend. This steady decline marks an increase in selling pressure and a decline in investor sentiment toward the token.
JASMY Targets Bullish Reversal Above 100-Day MA
Crypto analyst Jonathan Carter has mentioned that a downward channel is emerging. The momentum is shifting as trading volume starts to favor the setup. Analysts believe that the 100-day moving average may turn into support rather than resistance. Breaking out of this trend would reinforce the optimism.
The projected prices are $0.019, $0.023, $0.032, and $0.040. These targets are based on long-term strength above the moving average of 100 days. JASMY is at risk of additional decline without a confirmed breakout. The market confidence remains fragile due to the weaker sentiment, which is driving action in the near term.

Source: X
Trading Volume Falls as JASMY Open Interest Climbs
CoinGlass data shows lower market engagement. The volume of trading has been reduced by 14.77% to $22.36 million. Meanwhile, open interest was raised by 3.38% to $34.18 million. Despite the tightening of liquidity, the OI-weighted funding rate is currently at 0.0102%, suggesting that traders are still in motion.
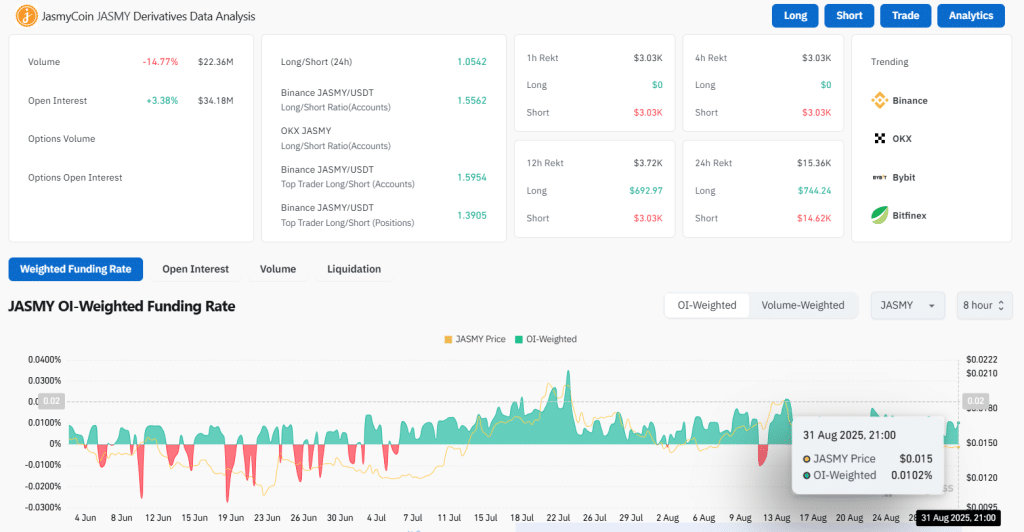
Source: CoinGlass
Also Read: XRP Price Warning Sparks Panic as Experts Predict Sharp Drop Below $2.78 Soon
RSI and MACD Signal Bearish Momentum
The Relative Strength Index (RSI) is 43.60, and the signal line is at 46.25. These levels put JASMY in a neutral position with a bias towards bearishness. An RSI that is below 50 depicts declining momentum. A further decline in the RSI may heighten selling and limit up movements.
The Moving Average Convergence Divergence (MACD) provides even more warning. MACD currently stands at -0.00037, just below the signal line at -0.00021. The histogram is at -0.00016, which supports the bearish view. The downward pressure is potentially to continue until the MACD line crosses above the signal line.

Source: TradingView
JASMY is approaching a critical juncture. Technical indicators emphasize poor momentum, however, exceeding $0.0148 may change the mood. Bearish momentum is likely to persist without confirmation. Traders are closely monitoring any strengths or further weakness signals as the token challenges this critical level.
Also Read: PEPE Price Holds Key Support: Can It Break Toward $0.00002500?


