 Skip to content


- PEPE holds at $0.000009887, showing a 0.48% daily drop and an 8.17% weekly decline with weaker volume.
- Support is at $0.00000920, and the triangle compression point points to a possible breakout if momentum builds.
- Analyst targets are $0.00001250, $0.00001450, $0.00001630, and $0.00002120 as resistance levels.
PEPE is currently trading at $0.000009887, representing a 0.48% decrease over the past day. The token has dropped 8.17% in the last week. Trading volume has decreased by 46.52%, currently $312.4 million. Despite this decline, the coin is still holding the $0.00000920 support zone. The price has been trading sideways for five days, which indicates a lack of direction.
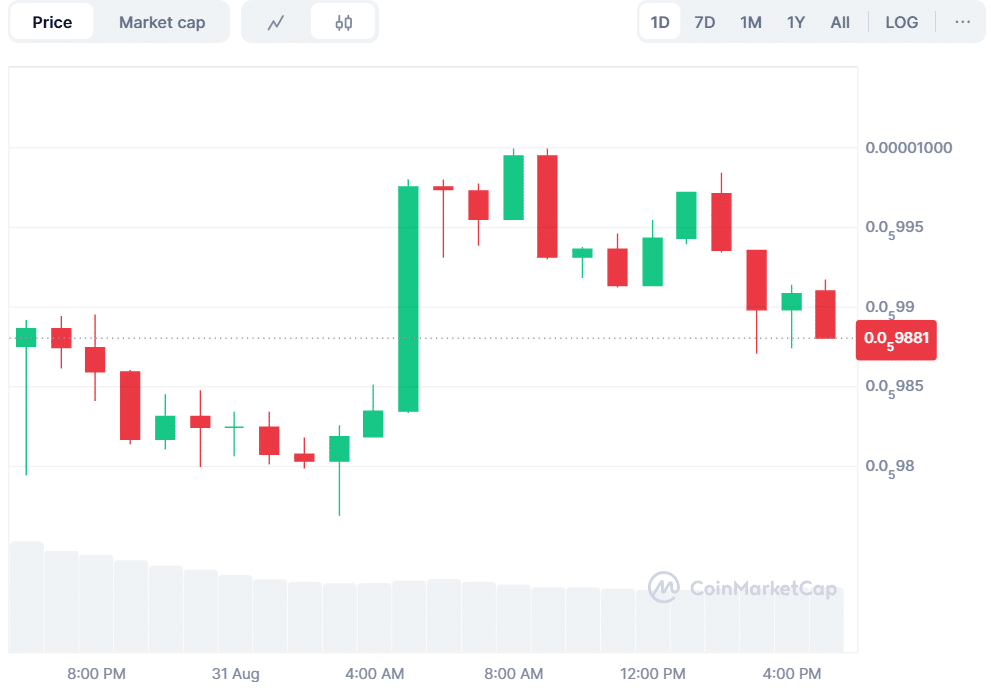
Source: CoinMarketCap
PEPE Support Holds as Breakout Setup Builds
Crypto analyst Jonathan Carter mentioned the symmetrical triangle formation. He said a sharp move is often indicated by compression within the formation. The support has remained firm, increasing the likelihood of a breakout. Traders are closely monitoring for confirmation.
Analysts shared potential upside targets on PEPE. He pointed to $0.00001250, $0.00001450, $0.00001630, and $0.00002120. Each level can be used as resistance if buyers return. These points can also create a stronger move upward if momentum is established.
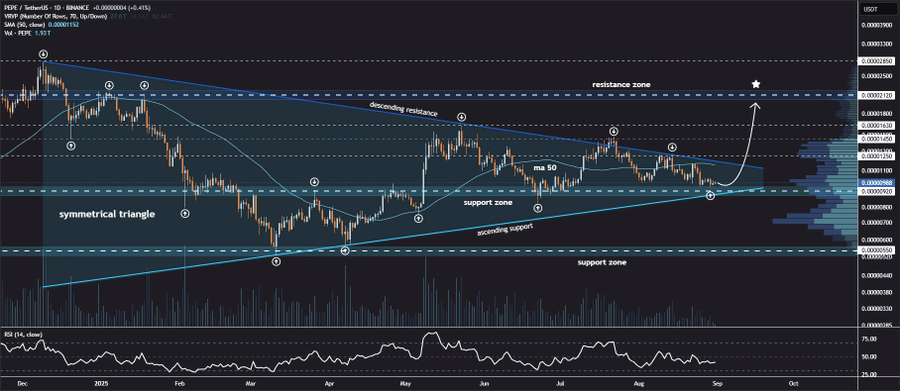
Source: X
Also Read: Amplify Files for XRP ETF Offering Monthly Dividends, Shaking Up Crypto Market
Open Interest Rises as Trading Volume Declines
CoinGlass data shows a decline of 43.64% in its trading volume, which is currently at $685.23 million. Open interest increased 0.56% to $570.21 million. This divergence indicates that traders are positioning for volatility, even as activity in spot markets fades. The OI-weighted funding rate is 0.0105%, which signals a slight long bias among futures traders.
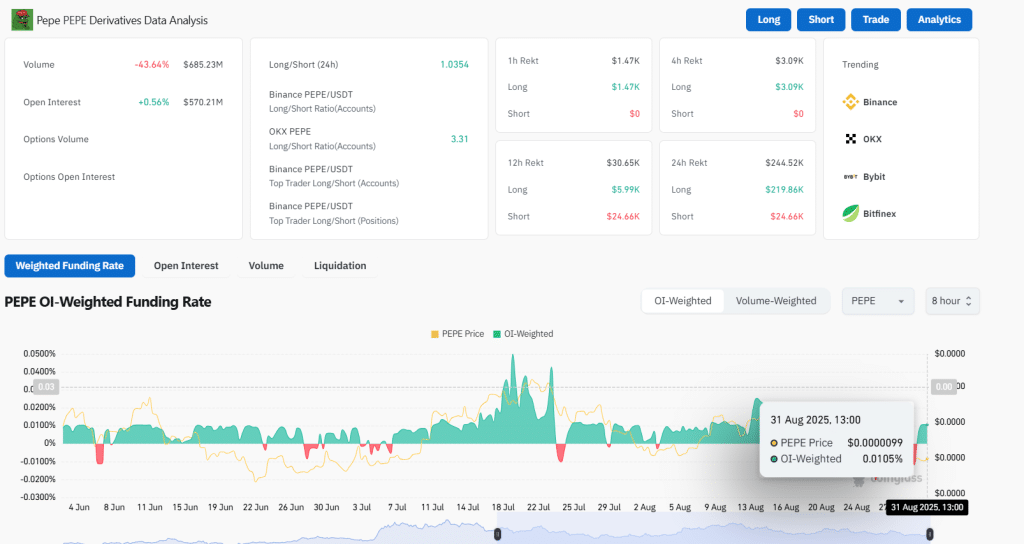
Source: CoinGlass
RSI Near Oversold as MACD Signals Bearish Pressure
The RSI 14 is at 41.87, and the signal line is at 43.94. This puts the token near oversold territory. The reading implies weak buying pressure but also indicates the potential for a rebound. This zone is often seen as a potential turning point for traders.
The Moving Average Convergence Divergence (MACD 12,26) still indicates bearish sentiment. The MACD line is at -0.00000041, and the signal line is at -0.00000033. This confirms the bearish crossover is in place. However, the histogram bars indicate a reduction of negative momentum, which points to potential stabilization in the near term.
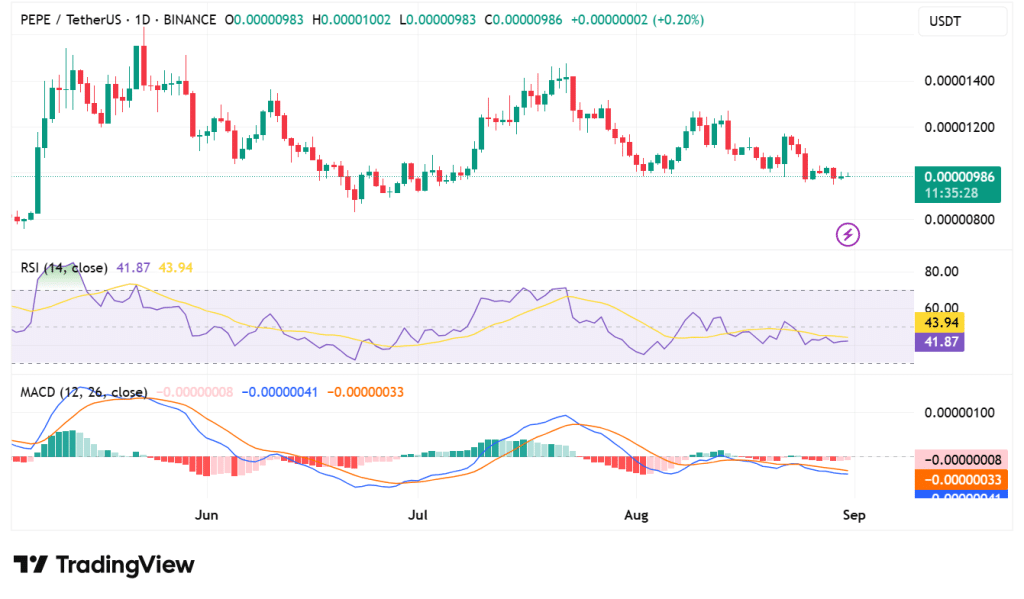
Source: TradingView
The long-term prognosis is uncertain. Demand has softened, but derivative markets remain active. The support level of $0.00000920 will be a key pivot in the upcoming sessions. A potential breakout move to higher resistance levels is possible from the base of this hold. A breakdown, however, can take the price lower before buyers take control again.
Also Read: 21Shares Launches Hyperliquid ETP on SIX Swiss Exchange with $2 Trillion Market Exposure


