 Skip to content


- Polkadot trades at $3.96 with rising volume and steady weekly gains boosting investor confidence.
- Analysts see a falling wedge pattern, with a breakout above $6.80 opening higher price targets.
- RSI at 50.13 and MACD buy signals point to strong momentum, but caution remains essential.
Polkadot (DOT) is currently trading at $3.96, representing a 2.16% increase over the past day. There was high activity as trading volume increased by 59.07% to reach $383.83 million. The weekly gains are 4.39%, which puts weight on investor confidence. Analysts point out that DOT is entering a precarious territory where pressure may result in a decisive blowout.
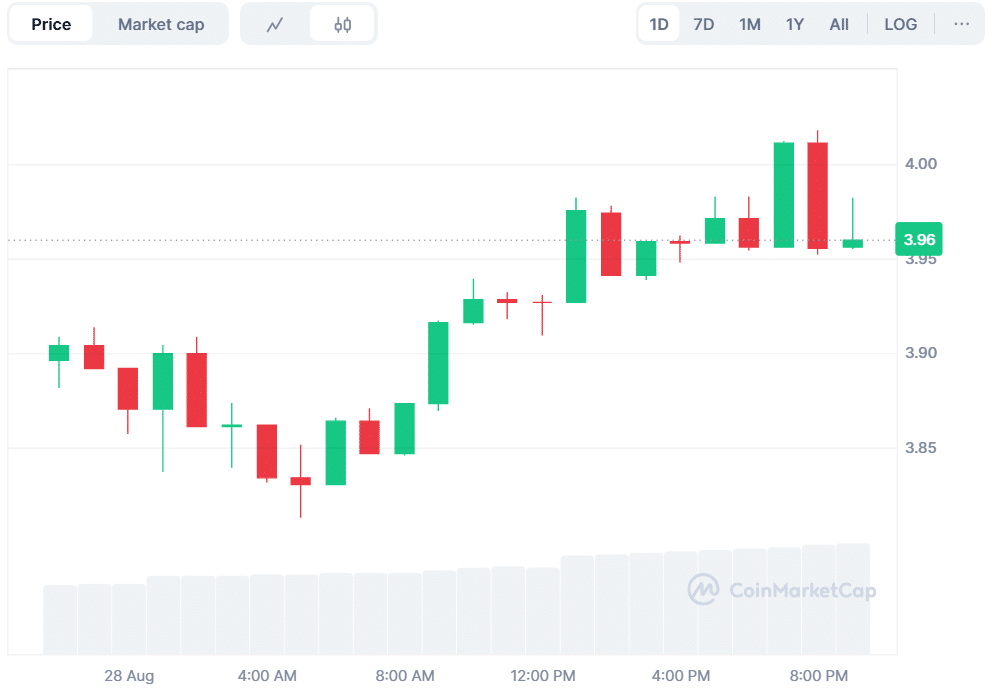
Source: CoinMarketCap
DOT Falling Wedge Signals a Critical Breakout Zone
Analyst Jonathan Carter highlighted a falling wedge pattern in the chart. In five weeks, resistance has been tested three times. The strength of each rejection was becoming weak, which indicated diminishing selling power. He indicated that a volume is still being built up. He believes that major investors are acquiring early positions prior to a breakout.
According to Carter, the wedge would be confirmed if there is a confirmed movement beyond $6.80. Targets are located at $4.54, $5.40, $6.50, and $7.60 once broken. He cautioned that most traders fear resistance. In comparison, winners are those who anticipate and purchase before the momentum picks up.
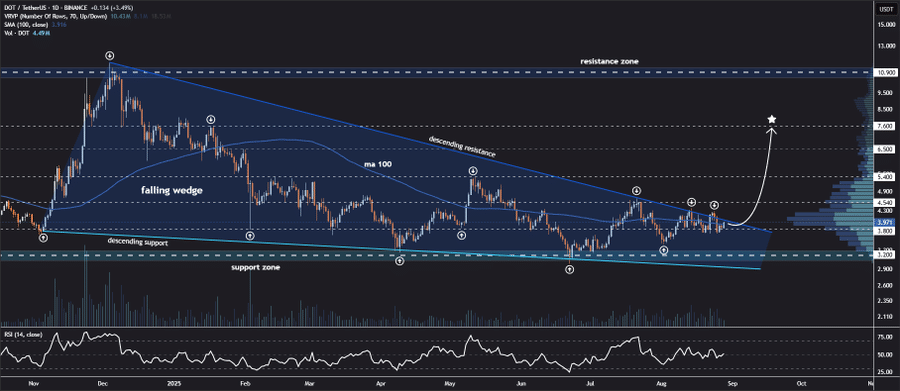
Source: X
Also Read: ETC Price Builds Momentum: Is a Surge Toward $25 and Beyond Imminent?
Rising Activity Shows Traders Backing DOT Momentum
According to CoinGlass data, the trading volume increased by 54.15% to $565.80 million. The open interest declined by a minor percentage, from 0.29% to $496.56 million. The OI-weighted funding rate is 0.0096%. Traders are still making premiums to maintain long positions, believing there is further upside.
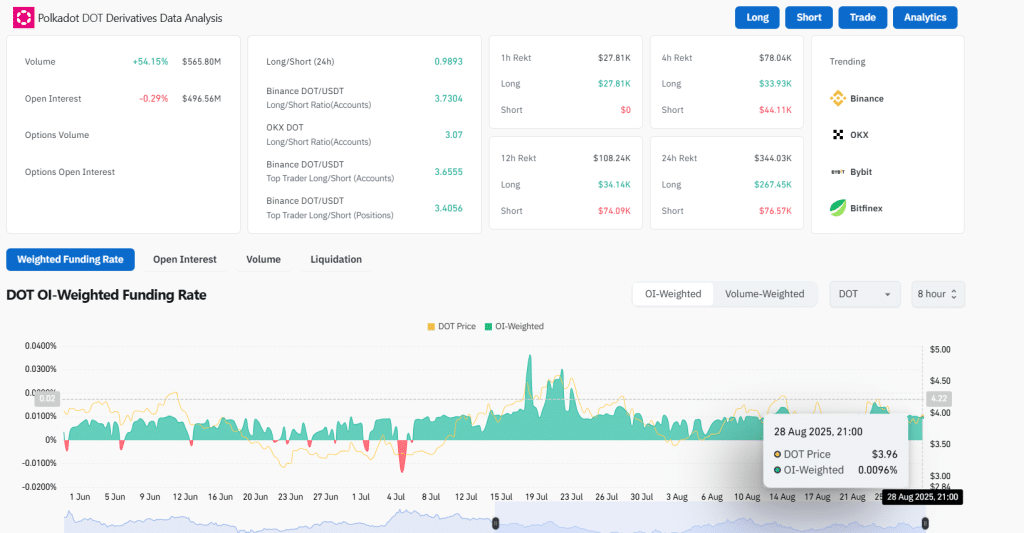
Source: CoinGlass
DOT Momentum Builds on Strong RSI and MACD
The bullish case is supported by technical signals. The 14-day Relative Strength Index (RSI) is at 50.13. This reading is strong but does not go overboard. It provides DOT with the space to advance higher without a corresponding pullback. This level has been considered to be a balanced level of strength and caution by traders.
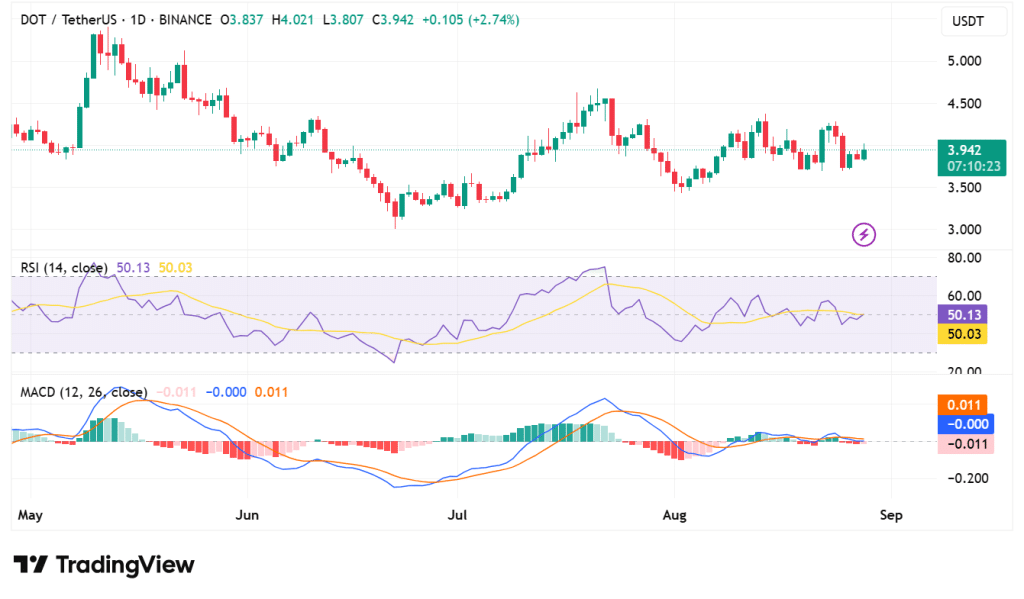
Source: TradingView
The Moving Average Convergence Divergence (MACD) also suggests an optimistic momentum. The MACD line is higher than the signal line, generating a buy condition. Analysts interpret this as a build-up of momentum, which may have good follow-through potential. Nevertheless, they mention that care should be taken in case momentum dies off too rapidly.
DOT exhibits an increase in volume, a strong chart pattern, and favorable technicals. The falling wedge pattern indicates an imminent breakout. If resistance above $6.80 decreases, it is feasible to attain higher levels in the short term. The upcoming trading sessions will determine whether Polkadot will affirm its bullish arrangement or stagnate at prevailing levels.
Also Read: Raydium (RAY) Price Prediction: Breakout at $4 Could Open Path to $6.2


