 Skip to content


- PYTH is priced at $0.1692, up 5.13% in 24h, with volume rising 24.89% to $85.85M, signaling higher activity.
- Ascending triangle on the 4H chart shows resistance at $0.185–$0.190, with breakout targets near $0.21–$0.23.
- RSI at 54.68 reflects mild momentum, while MACD divergence signals slowing strength around key resistance.
Pyth Network (PYTH) is currently trading at $0.1692, marking a 5.13% increase over the past day. Trading volume increased by 24.89% to $85.85 million, which indicates enhanced participation. Over the last week, PYTH declined by 1.46%, indicating a split feeling among investors.
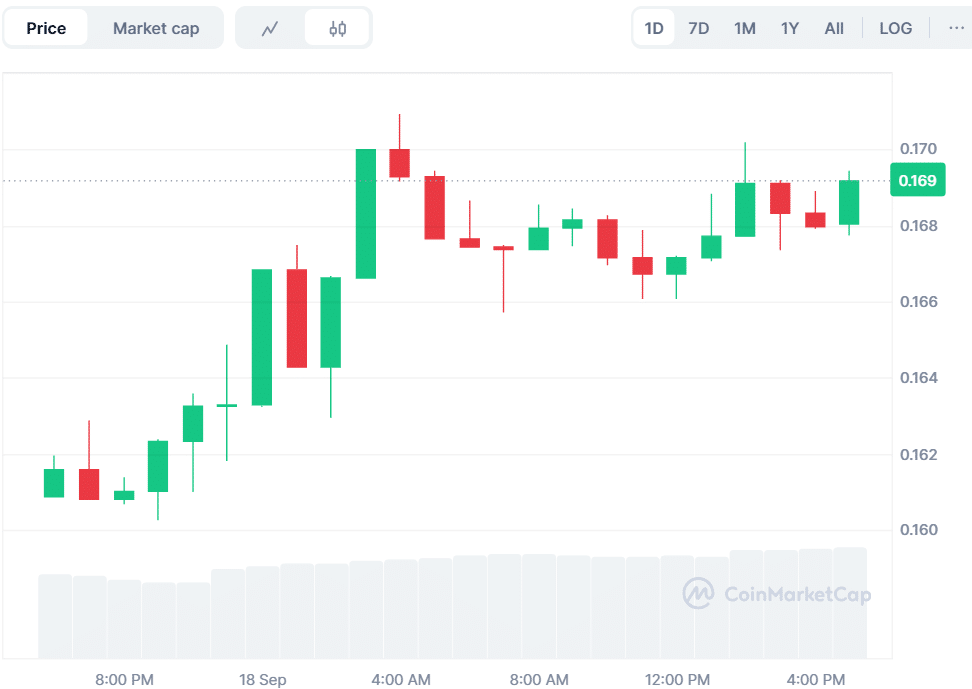
Source: CoinMarketCap
PYTH Builds Strength Within Ascending Triangle
Alpha Crypto Signal highlighted that on the 4-hour chart, PYTH is forming an upward triangle. The structure indicates consistent high lows acting at resistance at $0.185-$0.190. This trend is typically considered to be bullish since it indicates accumulation. The buyers will come into the market at higher levels every time, narrowing the price band and indicating an accumulation of pressure towards a breakout.
A clean close above $0.190 with high trading volume should confirm it. This action would create opportunities within the range of $0.21 to $0.23. Nonetheless, the structure breaks when the PYTH falls out of the trendline at the $0.160 mark. Subsequently, the price may retreat to the $0.145-$0.150 demand zone. The prognosis is optimistic, but it will rely on the break of resistance.
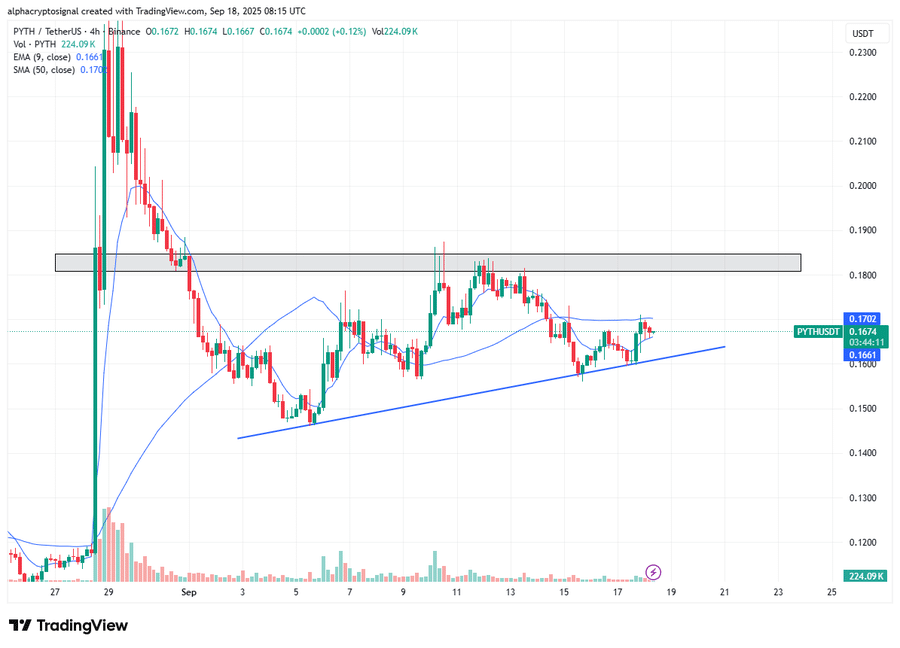
Source: X
Open Interest Climbs, Showing Stronger Market Positioning
According to CoinGlass data, the trading volume increased by 37.58% to reach $155.72 million. Open Interest increased by 7.31% to $112.46 million. The OI-weighted funding rate was 0.0044%. These numbers indicate traders gaining exposure with a slight bullish bias. There is increased participation, though confirmation rests on performance close to the resistance zone.
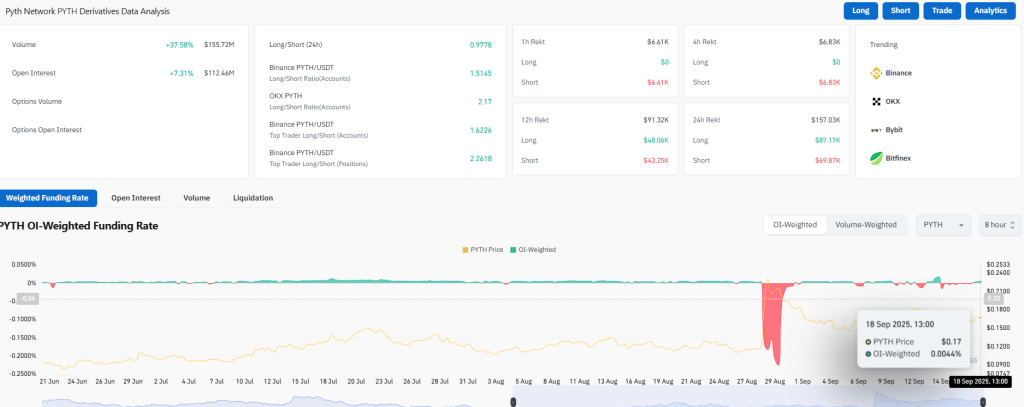
Source: CoinGlass
Also Read: Ether Machine Moves to Go Public, Eyeing Major Ethereum Expansion Through SPAC!
RSI Suggests Growth While MACD Cautions Weakness
The Relative Strength Index (RSI) stood at 54.68, slightly lower than the neutral 55.00. This level demonstrates a weakly bullish movement but is not overbought. RSI indicates equilibrium between buyers and sellers. It indicates space as a possibility of further increase with momentum.
The Moving Average Convergence Divergence (MACD) provided a pessimistic forecast. The MACD line was 0.0066 and the signal line was 0.0083. The histogram reflected -0.0017 indicating slight bearish divergence. This implies that momentum has decelerated following the recent gains.
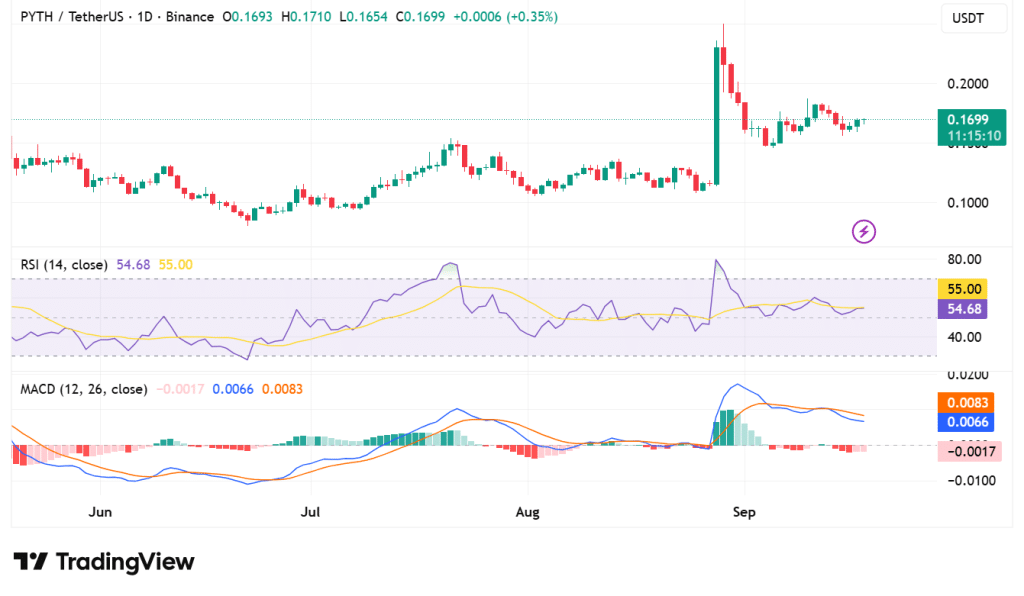
Source: TradingView
PYTH is trading within a narrow band with support of $0.160 and resistance of $0.190. Buyers continue to defend the trendline, while sellers are blocking higher levels. The rally could be extended to $0.23 in case of a breakout. Breaking the support will result in a fall into the demand range of $0.145 to $0.150.
Also Read: Ripple’s RLUSD Stablecoin Powers New Onchain Trading With DBS and Franklin Templeton


