 Skip to content


- Raydium rises 6.72% to $3.84 as trading volume spikes 170%+ to $359M, showing strong buyer demand.
- A breakout above $4 may target $4.8–$6.2 soon, while key support remains at $3 for downside risk.
- RSI at 62 and MACD positive confirm bullish momentum with further upside potential in play.
Raydium (RAY) is currently trading at $3.84, showing an increase of 6.72% in the last 24 hours. The token is experiencing a rise, accompanied by a significant increase in trading volume, which has surged by 170.73% to reach $359.07 million. This expansion indicates the market players interest and the high pressure of buyers.
Over the past week, RAY has grown by 16.85%, which reinforces its bullish prospects. The gradual increase in activity and price is evidence of increased confidence in traders. As market analysts note, the current trend of Raydium indicates high demand levels and continued interest from investors.
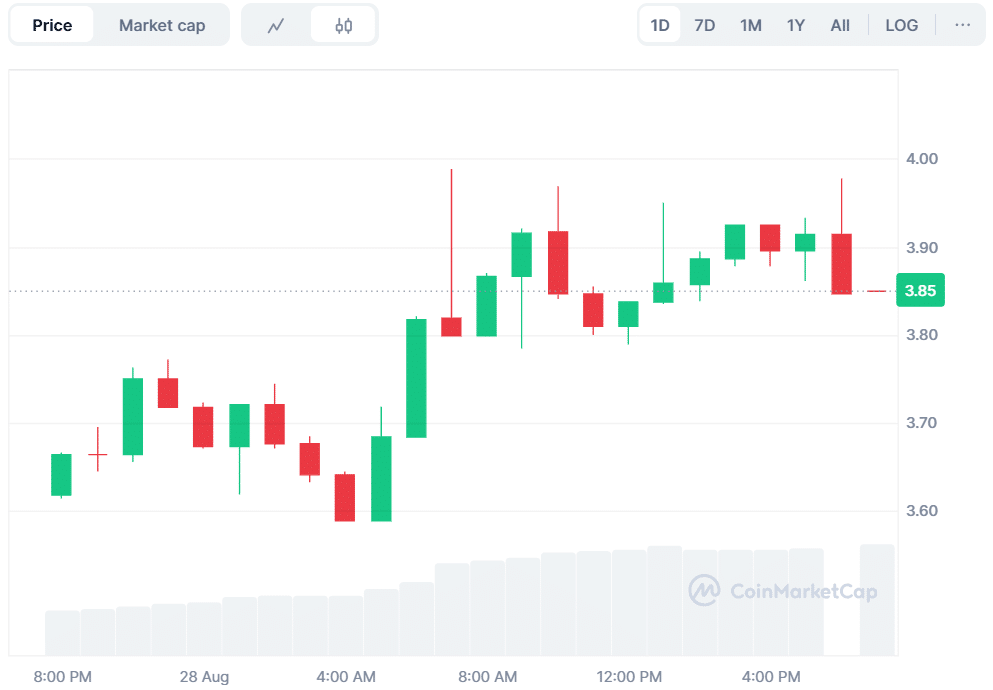
Source: CoinMarketCap
Raydium Eyes Breakout Toward $4 Resistance
Crypto analyst Crypto Pulse highlighted that RAY has left a symmetrical triangle, a technical structure that can be a hint of the beginning of a new trend. The bulls are currently aiming for the resistance area of $4.0 and $4.2, which is regarded as the next significant level to be tested.
In case the price stabilizes above this level, analysts imply that targets might be increased to $4.8 and possibly even to $6.2 within weeks. A failed breakout, however, might cause a pullback, moving the token towards the support level of $3.
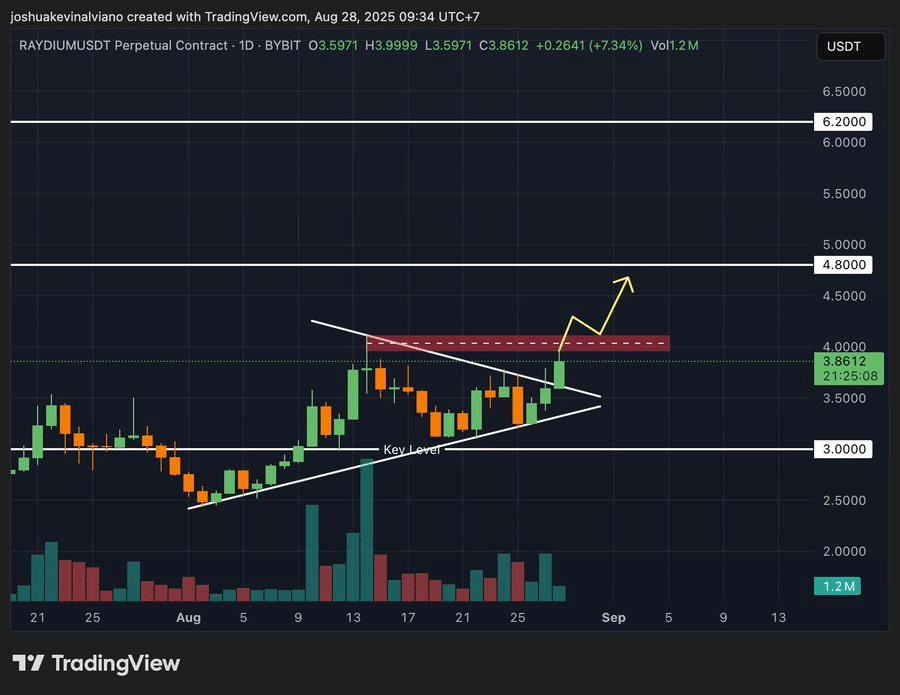
Source: X
Also Read: XRP ETF Demand Surges: Experts Reveal Shocking Growth and Approval Odds!
Raydium Records Sharp Trading Spike with Stable Funding Rate
CoinGlass data shows a sharp surge in trading activity. Trading volume increased 180.93 percent to $149.39 million, indicating greater involvement in the market. Open interest also shifted up by 6.62% to $43.84 million, which regarded higher exposure by futures traders.
The funding rate is an indicator of stability. This OI-weighted funding rate is at 0.0073%, indicating a balanced leverage. This is a sign that organic buying is behind the rally and not too much speculation.
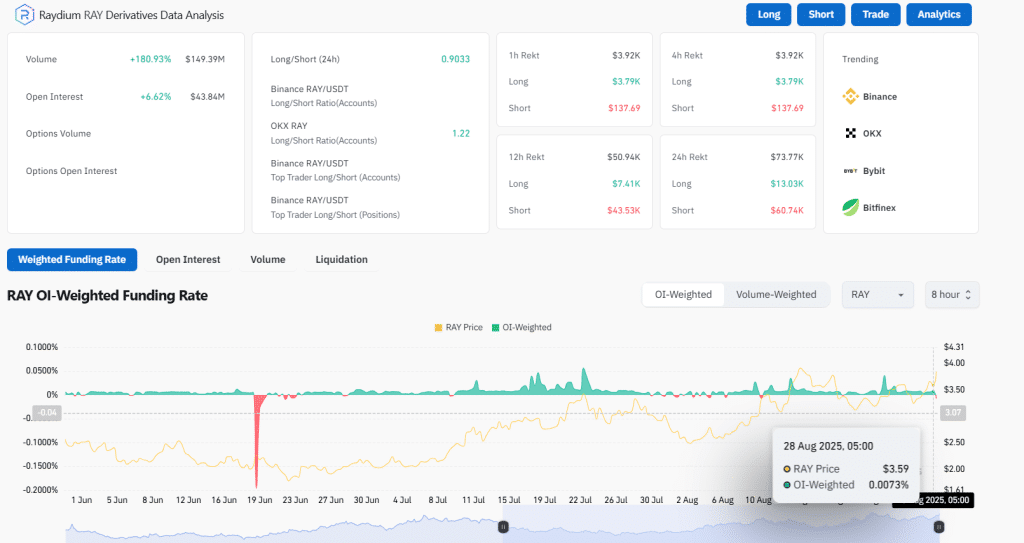
Source: CoinGlass
RSI Near 62 and Positive MACD Highlight Raydium’s Strength
The Relative Strength Index (RSI) is 61.97, higher than the neutral point of 50, but not overbought yet. This indicates good purchasing power, and there is room to expand. Another positive indicator is the Moving Average Convergence Divergence (MACD). The MACD line is 0.165, which is higher than the signal line at 0.153. The histogram is marginally positive at 0.012.
Source: TradingView
Additionally, RAY exhibits exceptional derivative conformity, indicators, and price. Breaking above $4 can test the subsequent bullish leg, and dropping below $3 support can be rejected. At present, Raydium is a token that is being actively accumulated.
Also Read: ETC Price Builds Momentum: Is a Surge Toward $25 and Beyond Imminent?


