 Skip to content


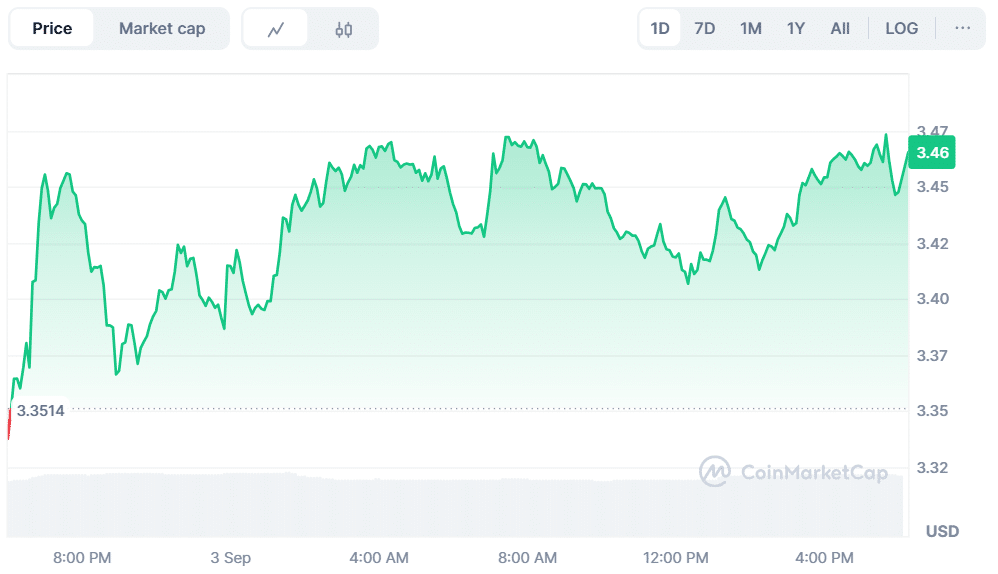
- RENDER is at $3.46, up 3.09% daily, but still down 3.68% weekly, showing mixed trader sentiment.
- The descending triangle pattern suggests that momentum may be building, which could lead to an upward movement.
- RSI at 44.97 and negative MACD highlight weak momentum despite rising trading volume.
RENDER is currently trading at $3.46, which represents a 3.09% increase in the past 24 hours. The market activity is increasingly showing signs of interest, and the trading volume has increased by 6.73% to $54.46 million, indicating a bullish short-term outlook.
Source: CoinMarketCap
Despite the daily price movement, RENDER has lost 3.68% weekly, suggesting that the overall trend is still in a level of selling pressure. This divergence between the short-term and the longer-term weakness highlights the cautious sentiment of traders.
RENDER Consolidates Near $3.50 as Buyers Eye Higher Targets
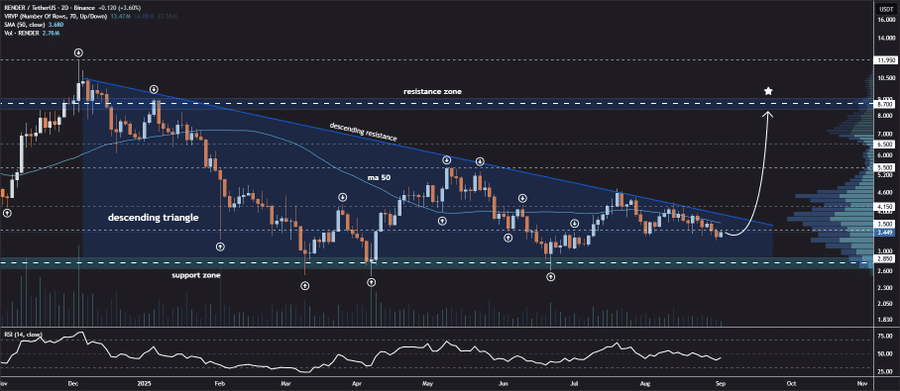
Analyst Jonathan Carter mentioned that RENDER broke into a downward triangle pattern. Selling pressure decreased, and buyers stepped back in, but prices consolidated near the $3.50 level. He said that triangle compression can be an indication of a potential breakout, and traders should pay close attention to the setup.
Analysts also detailed potential targets if momentum continues to build. The first level is $4.15, the second is $5.50, and the third level is $6.50. A sustained move could carry the coin to $8.70. The formation has attracted both day traders and investors with a longer-term perspective, as it is a more significant change in the underlying trend.
Source: X
Also Read: Dogecoin Treasury Strategy: CleanCore Secures $175M Investment Backed by Foundation
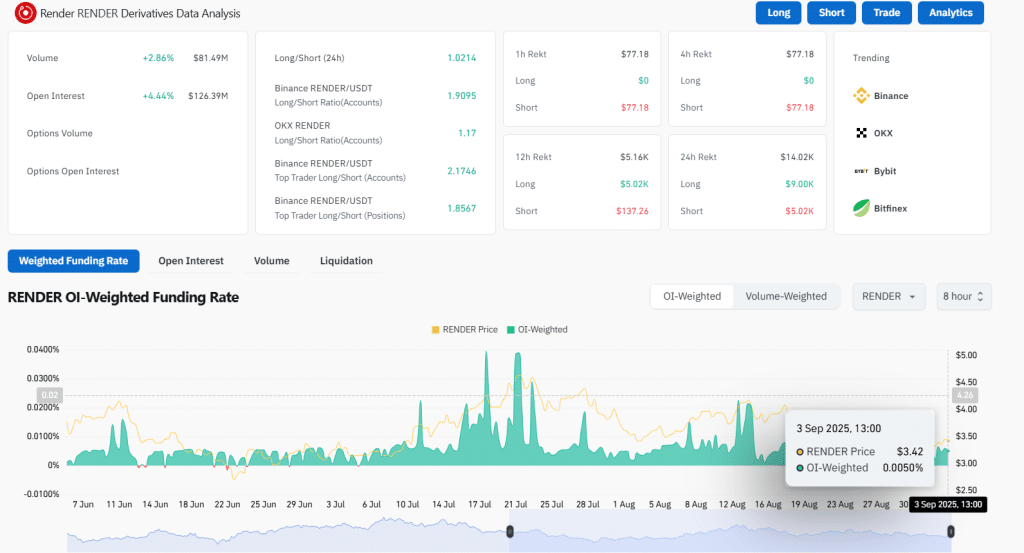
Trading Volume Climbs as Open Interest Strengthens Further
CoinGlass data indicates an increase in trading volume of 2.86% to $81.49 million. Open interest increased 4.44% to $126.39 million. The funding rate stood at 0.0050%. Balanced leverage implied disciplined speculation. There was consistent growth in engagement with no evidence of excessive risk-taking.
Source: CoinGlass
RSI Below 50 and MACD Negative Show Pressure
The Relative Strength Index was at 44.97. The signal level was 45.26. Both values remained below 50. This demonstrated a deficiency of momentum and force. RSI levels above 70 are considered overbought zones. Numbers below 30 are considered oversold. A move above 55 would be supportive of a bullish case.
The Moving Average Convergence Divergence was still negative. The MACD line read -0.103. The signal line showed -0.083. The histogram printed -0.020. These values indicated mild bearish pressure. However, the convergence between the MACD and signal was closer, which indicated that a crossover was possible.
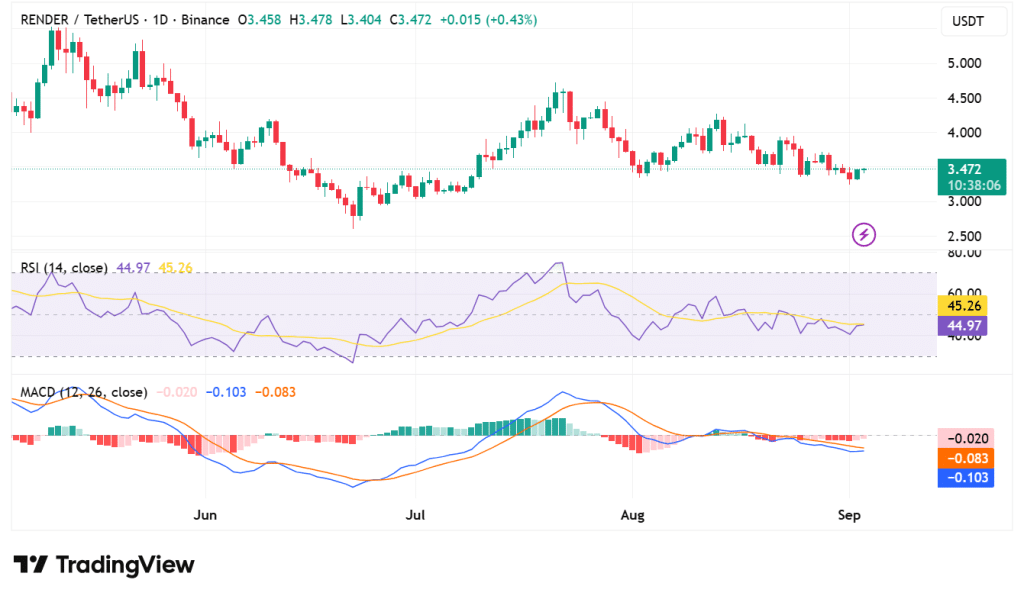
Source: TradingView
The picture painted by RENDER was divided. Short-term strength was shown in price and derivatives action. Momentum signals were more broadly weaker. Traders considered both sides before making moves.
The next few sessions will be decisive. A breakout above resistance may propel RENDER higher. Failure to break would represent further consolidation. The market’s interest is sustained as the signals converge.
Also Read: Bitcoin Reserve Strategy: CIMG Raises $55 Million Through Share Offering


