Skip to content


- The TD Sequential indicator has issued a buy signal on XRP’s 1-hour chart, hinting at a potential bullish reversal.
- XRP has completed nine consecutive red candles, a pattern often preceding an upward move.
- A similar buy signal has been identified for Stellar (XLM), indicating a potential rebound for both assets.
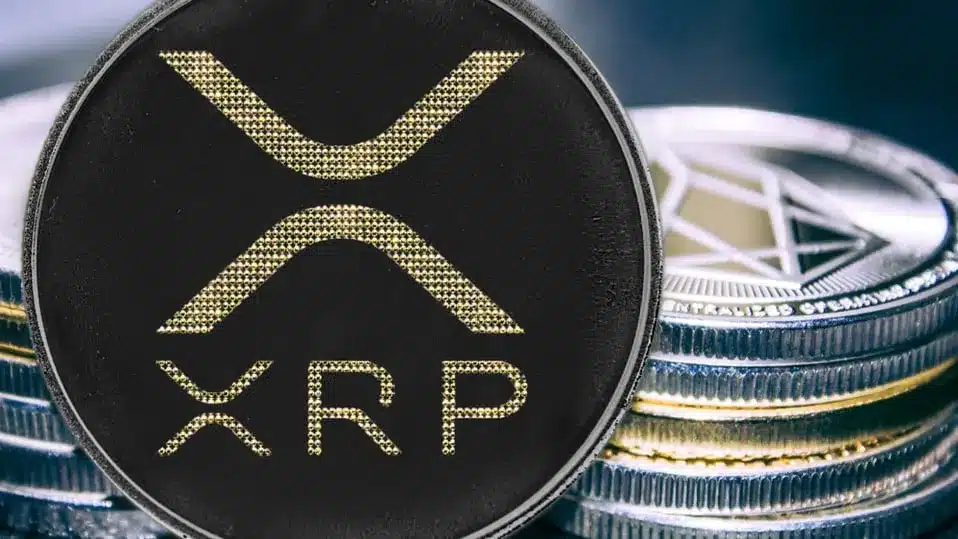
Ripple (XRP) is currently holding above its crucial support level and aiming for higher price targets. Over the past week, XRP has been down by 7.87%, while in the last 30 days, it has been down by 17%. Despite this decline, XRP is holding strong above its support level.
Currently, XRP is trading at $2.60, with a 24-hour trading volume of $10.57 billion and a market cap of $149.44 billion. The asset has declined 2.88% in the past 24 hours.
$XRP looks set for a rebound as the TD Sequential indicator flashes a buy signal on the hourly chart! pic.twitter.com/PYN6TuyI8W
— Ali (@ali_charts) February 21, 2025
XRP’s TD Sequential Flashing Major Buy Signal
In a recent post on X (formerly Twitter), crypto analyst Ali Martinez highlighted a crucial technical indicator suggesting a potential price reversal for XRP. The TD Sequential indicator, a widely used tool in technical analysis, has signaled that the cryptocurrency might be primed for an upward move.
$XRP looks set for a rebound as the TD Sequential indicator flashes a buy signal on the hourly chart! pic.twitter.com/PYN6TuyI8W
— Ali (@ali_charts) February 21, 2025
The TD Sequential indicator is designed to identify potential trend reversals in asset prices by analyzing candlestick patterns. It consists of two phases: the setup phase and the countdown phase.
This phase counts nine consecutive candles of the same polarity (either red for bearish or green for bullish). When nine such candles appear on the chart, the TD Sequential triggers a potential reversal signal.
If the setup phase plays out, the countdown phase begins, where candles are counted up to thirteen. A completed countdown signals another potential reversal point, a trend continuation, or a shift in the opposite direction.
According to Martinez, XRP has just completed the setup phase on its 1-hour chart, printing nine consecutive red candles. This formation suggests that the asset may have reached a local bottom, setting the stage for a potential rebound.
The key takeaway from this signal is that XRP could experience a short-term price surge if the pattern holds. However, given that this signal has emerged on a lower timeframe (1-hour chart), the expected price increase might be limited in scope compared to longer-term setups.
XRP and XLM Flash Bullish Buy Signals
Interestingly, XRP is not the only cryptocurrency flashing a bullish TD Sequential signal. Martinez also pointed out that Stellar (XLM) has displayed a similar buy setup on its hourly chart.
“Stellar $XLM is ready to rebound as the TD Sequential indicator shows a buy signal on the hourly chart!” Martinez noted in another X post.
$XRP looks set for a rebound as the TD Sequential indicator flashes a buy signal on the hourly chart! pic.twitter.com/PYN6TuyI8W
— Ali (@ali_charts) February 21, 2025
While these signals hint at potential reversals, traders should remain cautious and consider other technical factors before making investment decisions. Whether this TD Sequential setup will translate into a significant XRP and XLM price recovery remains to be seen, but the crypto market is watching closely.
XRP Price Poised for Breakout: $3.4 Target
Another crypto analyst, EGRAG CRYPTO, pointed out that the price action remains unchanged, continuing to consolidate within the Ascending Triangle. Historically, this pattern breaks to the upside approximately 70-75% of the time, while downside breakouts occur around 25-30%. Moving toward the $3.2–$3.4 range remains the most likely outcome based on these probabilities.
$XRP looks set for a rebound as the TD Sequential indicator flashes a buy signal on the hourly chart! pic.twitter.com/PYN6TuyI8W
— Ali (@ali_charts) February 21, 2025
Related | Financial Services Committee Urges FDIC to Reform Crypto Banking Rules
How would you rate your experience?