Skip to content


- SEI trades at $0.2860, down 1.72% in 24h, while volume jumps 20.08% to $149.49M, showing strong trader participation.
- RSI at 46.12 and MACD bearish crossover signal weak momentum, keeping SEI under short-term bearish pressure.
- Key support holds at $0.285, with upside targets at $0.350, $0.430, $0.480, and $0.555 if a rebound is confirmed.
SEI is currently trading at $0.2860 with a 1.72% decline in the past 24 hours. The trading volume has increased by 20.08%, and it is currently at $149.49 million. The increase in the activity reflects greater market involvement. Although the trading volume has increased, the prices continue to exhibit weakness.
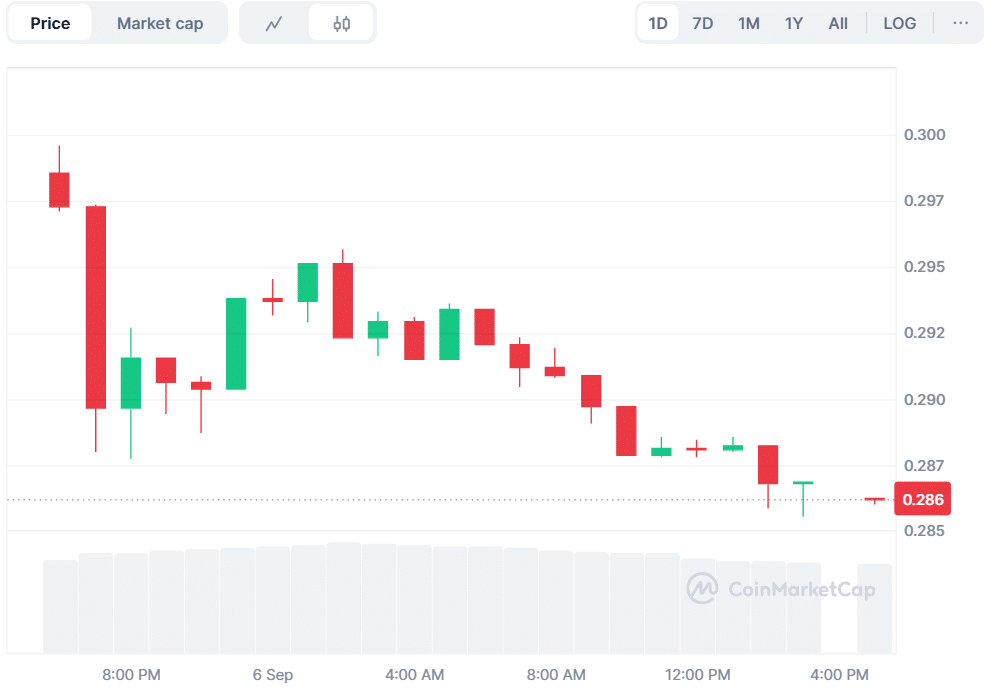
Source: CoinMarketCap
In the last seven days, SEI has fallen by 0.79%. This depicts a slight but gradual decrease. The price has not risen as a result of increased trading activity. The coin still is under bearish pressure in the short term.
SEI Tests Key Zone to Define Short-Term Trend
Analyst Jonathan Carter highlighted the neckline retest at SEI. He noted that the coin is holding the opposite head-and-shoulders breakout at the level of $0.285. This is a very important zone that traders take seriously.
Once SEI confirms that a bounce at this level is not imminent, it is possible that upward targets will be widely implemented. The possible levels of resistance are $0.350, $0.430, $0.480, and $0.555. Within this range, a price response can define the sentiment in the short term.
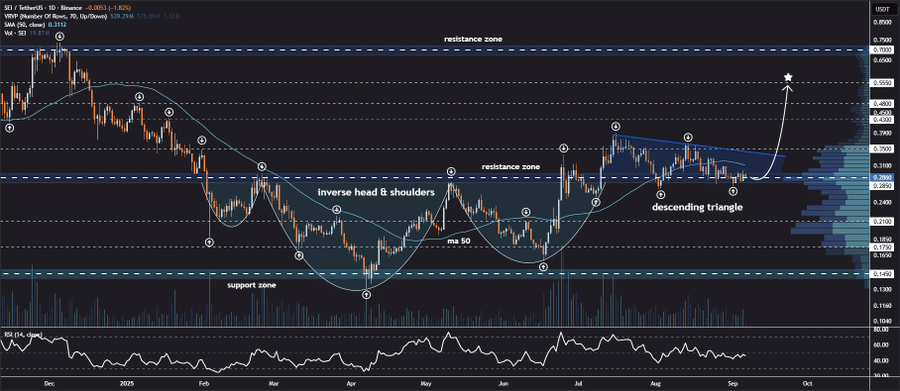
Source: X
SEI Trading Volume Climbs as Open Interest Declines
According to CoinGlass data, the trading volume has grown by 15.27% to the level of $265.34 million. The open interest has decreased by 4.69 percent to $232.75 million. The OI-weighted rate of funding is 0.0106%. This signifies light-weighted bullish positioning by leveraged traders. These mixed signals point to a market where buyers are very active, but long positions are cautious.
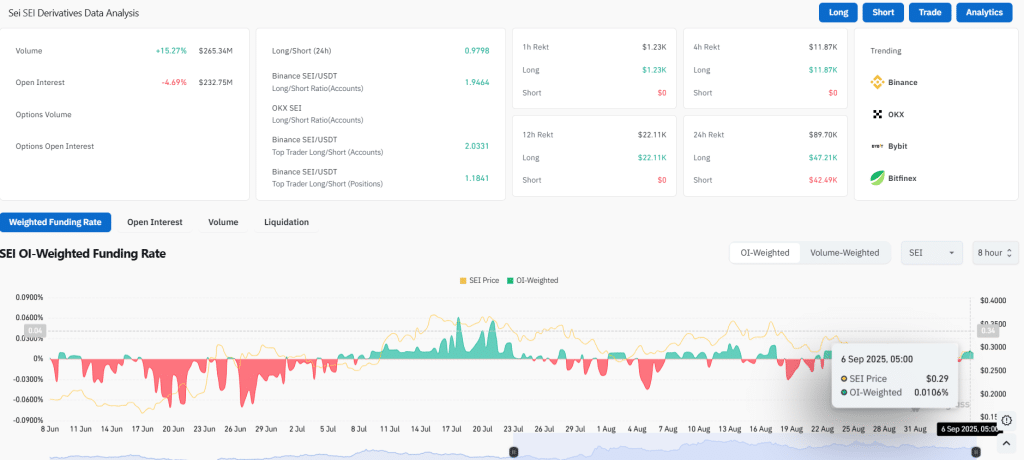
Source: CoinGlass
Also Read: Bitcoin Treasury Fund Launches in Asia as Sora Ventures Targets $1B
Technical Indicators Point to Limited Momentum
The Relative Strength Index (RSI) stands at 46.12, which indicates a low level of buying interest in the market. Readings lower than the 50 mark usually indicate less demand and little strength of bulls. The SEI is currently in a neutral-bearish position, and the directional movement appears to be restricted.
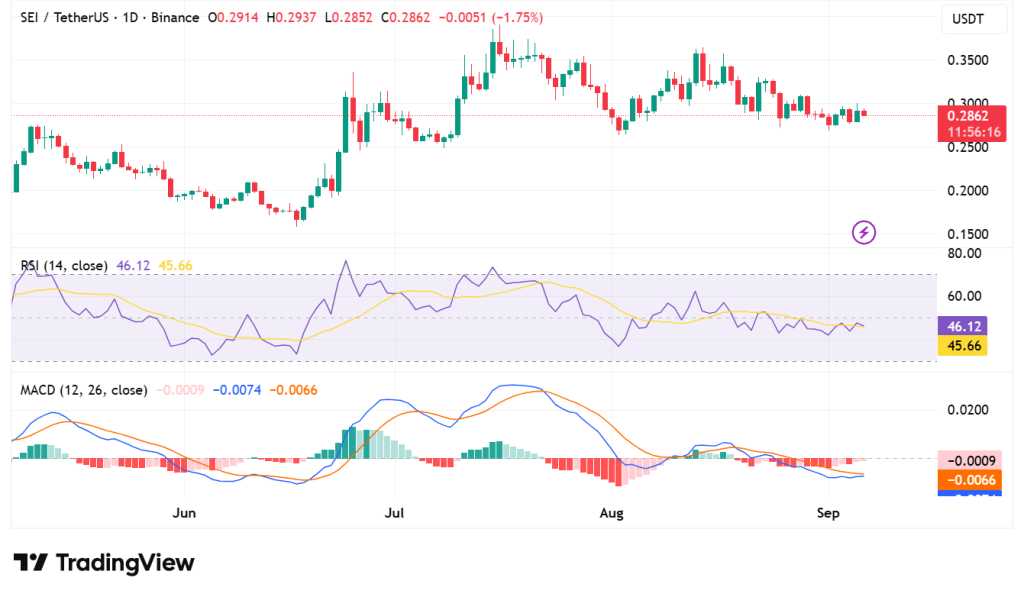
Source: TradingView
Moving Average Convergence Divergence (MACD) also represents the mild bearishness. The MACD line is located at -0.0009, which is lower than the signal line at -0.0066. Meanwhile, the histogram is at -0.0074, which is to further confirm pressure towards the downside. The combination of these indicators shows that market momentum is weak.
The short-term perspective of SEI will require it to retain major support. RSI and MACD values indicate a lack of strength, and the short-term momentum is low. Failure to maintain over $0.285 can drive it to additional losses.
Also Read: SEC Forms International Task Force to Combat Offshore Market Fraud: Report