 Skip to content


- SEI shows positive price growth, but declining trading volume indicates weakening market participation despite the rise.
- A breakout above $0.229 resistance could shift market sentiment, while $0.173 support could trigger a short-term reversal.
- The falling wedge pattern suggests a potential bullish reversal, with price aiming for $0.205-$0.215 if volume supports the breakout.
SEI is currently trading at $0.1942, which is an increase of 3.13% over the last 24 hours. Nonetheless, trading volume has declined by 20% and is currently at $85.5 million. This fall in volume indicates a drop in market activity, even though the price is rising. The price of SEI has increased by 0.48% within the last week, which is moderately but steadily growing its value.
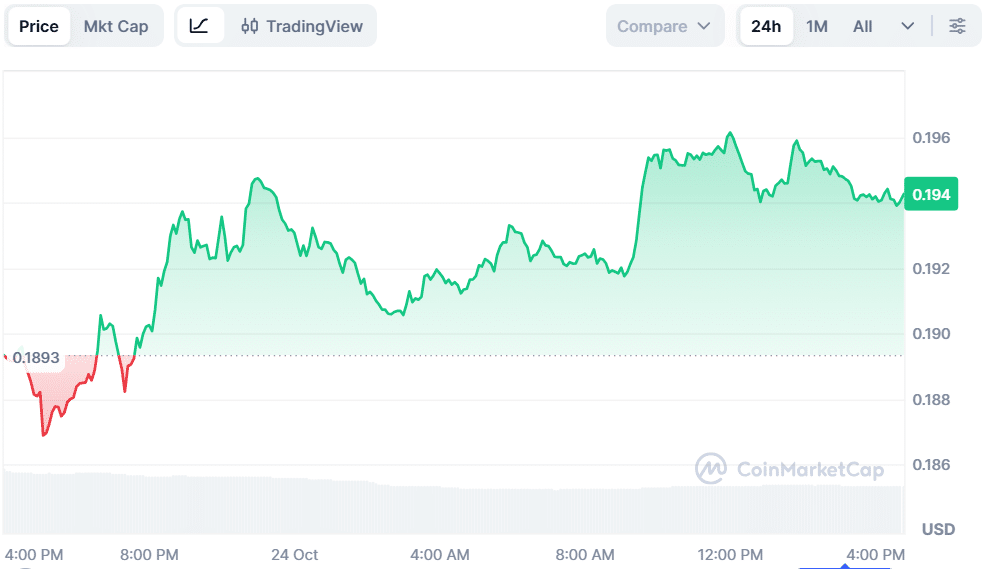
Source: CoinMarketCap
More Crypto Online, a popular analyst, has highlighted that SEI should surpass the $0.229 resistance point to get market sentiment to change into a more optimistic position. The market will continue to be weak until this occurs. On the negative side, there is a vital support of $0.173. A short reversal would be likely in the event that the price remains above this support.
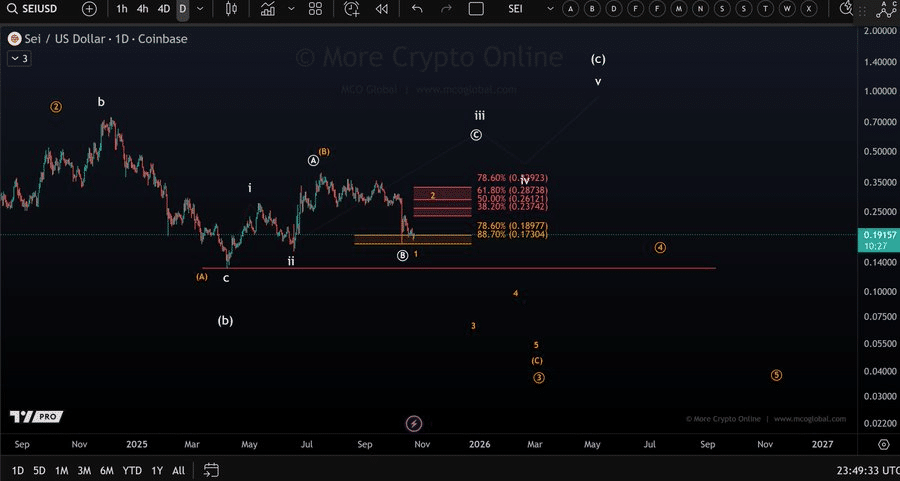
Source: X
Potential Bullish Reversal as SEI Forms Falling Wedge Pattern
Moreover, another analyst, Alpha Crypto Signal, mentioned that SEI is shaping a falling wedge pattern. The trend usually indicates the bottom of a falling market, which may cause a possible upward turn. As long as SEI penetrates the wedge resistance at a good volume, it might drift the price to the range of $0.205-$0.215.
Also Read: Fidelity Expands Solana Support Across Crypto Platforms
The structure supports buyers in the short term, as long as SEI does not drop below the $0.185 support level. Breaking above this important level would be a signal of further support, which would enable the coin to possibly fly higher. This trend would lead to a positive change in the market sentiment, provided it unfolds as anticipated.
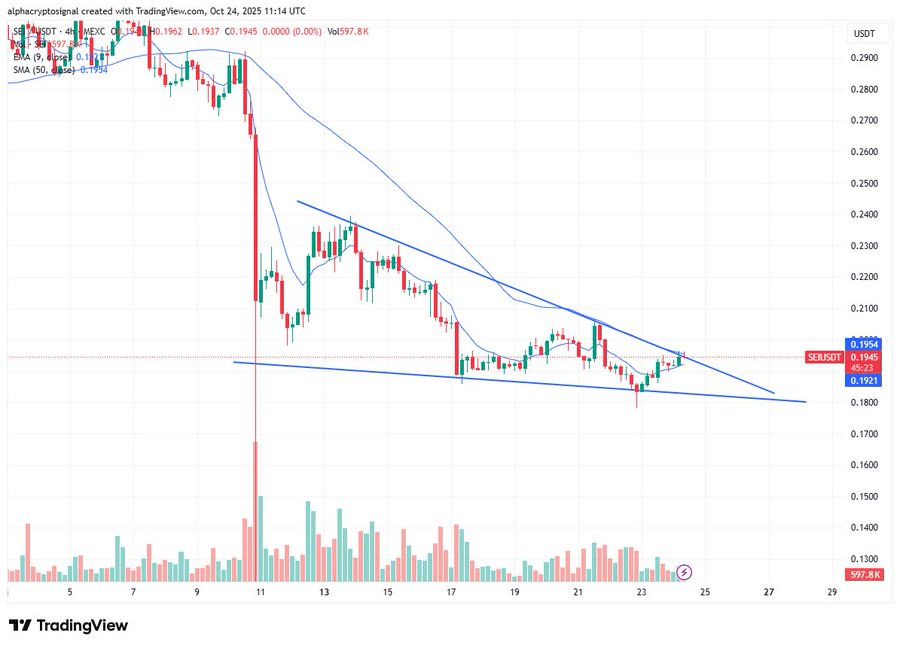
Source: X
SEI’s RSI and MACD Signals Suggest Market Conditions Could Improve
The Relative Strength Index (RSI) is 35.20, and it indicates that SEI is in the oversold range. This is not extreme, but this shows that there may be a price reversal should the conditions improve. RSI is below the mark of 50, indicating poor buying power. When the RSI shifts over 50, it might mean increased buying power, which may cause an upward movement of the price.
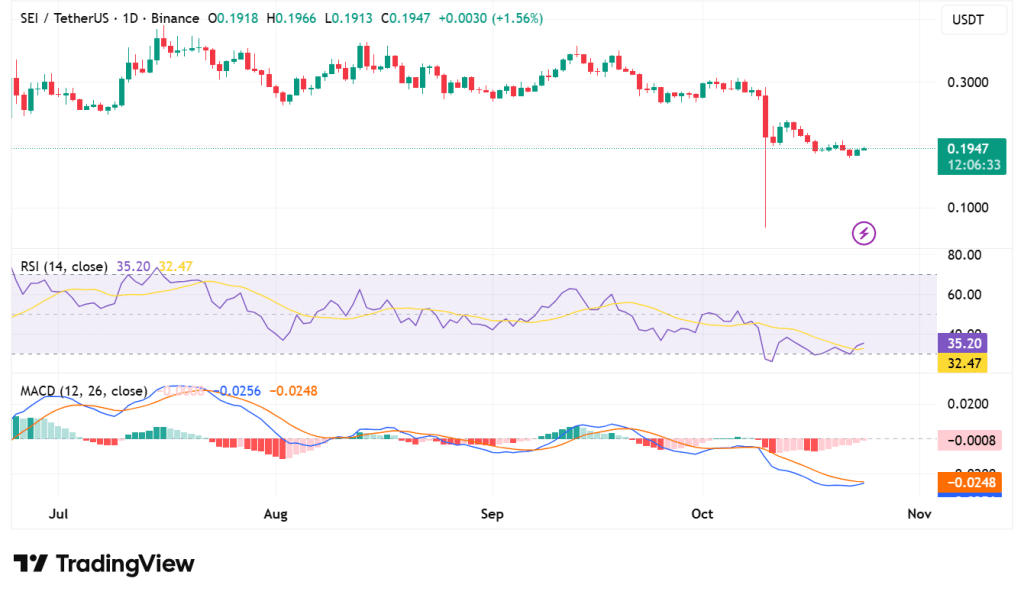
Source: TradingView
The Moving Average Convergence Divergence (MACD) is also exhibiting a downtrend. The MACD line stands at -0.0248, and the signal line at -0.0256. This represents negative momentum. The histogram, however, is shrinking, indicating that the selling pressure declines. It indicates that the bearish trend is growing weaker, and a possible reversal might occur.
Also Read: Revolut, Blockchain.com, and Relai Secure MiCA Licenses for Expanded Crypto Services


