 Skip to content


- Solana trades at $208 after a daily drop, with trading volume also moving lower at $13 billion.
- Despite the dip, Solana posts a strong 14.42% weekly gain, showing resilience and investor demand.
- Analysts eye $185 support, $210 breakout level, and $250 resistance as critical Solana price markers.
Solana (SOL) is currently trading at $208, and it has fallen by 1.98% during the last 24 hours. The trading volume has declined, falling 4.27% and currently standing at $13 billion, indicating a slowdown in short-term momentum.
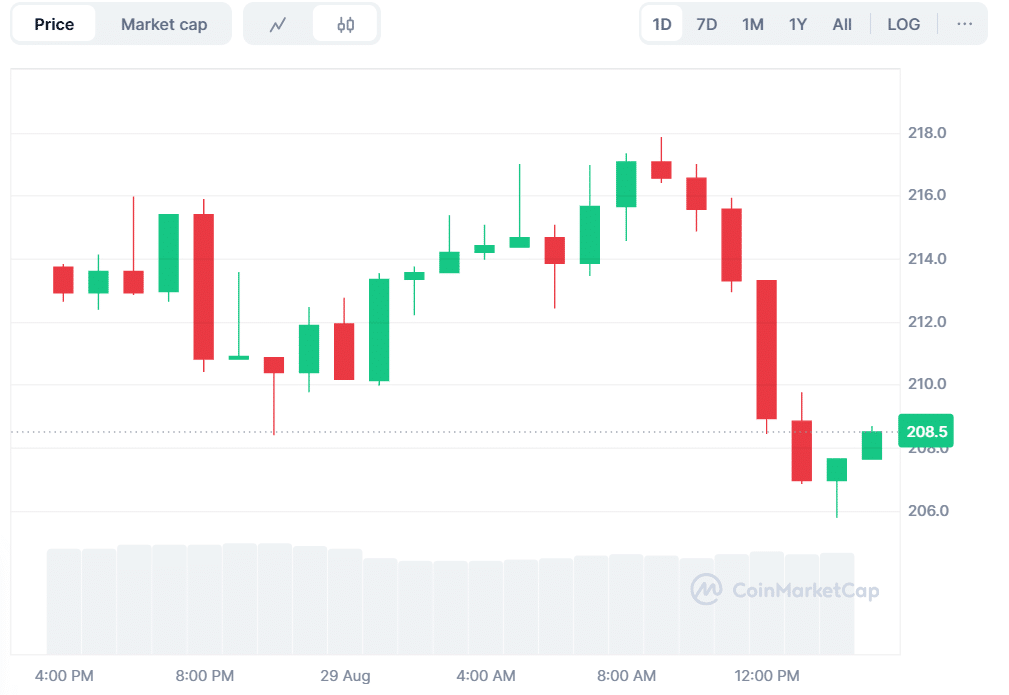
Source: CoinMarketCap
Solana has had a good week despite the daily setback. Over the past seven days, the token has risen 14.42 percent, which indicates its value and investor confidence as well as the strength of the overall market.
Solana Faces $210 Breakout Test With $185 as Key Support
CryptoPulse, an analyst, has highlighted that Solana may soon challenge $250. A breakout above $210 may serve as confirmation of strength. Any failure to push higher may necessitate a retest of $185. The bullish case remains valid as long as the price holds above $185. The loss poses a danger of reversal and possible further correction.
The price structure supports consolidation over $200. The new safety net is the $185 level. Going against it can provide impetus to selling. The next barrier that bulls are looking at is $210. The clearance of that zone would bring Solana closer to $250. This level acts as both a technical and psychological barrier.
Solana Derivatives Show Mixed Market Sentiment
CoinGlass data shows that open interest is down 0.31% to $13.32 billion. Meanwhile, the volume of trading was raised by 2.22 percent to 53.91 billion dollars. The rate of funding is 0.0054%, which is a slight bullish slant. Derivatives data suggests cautious positioning. The traders stay alert without excessive leverage.
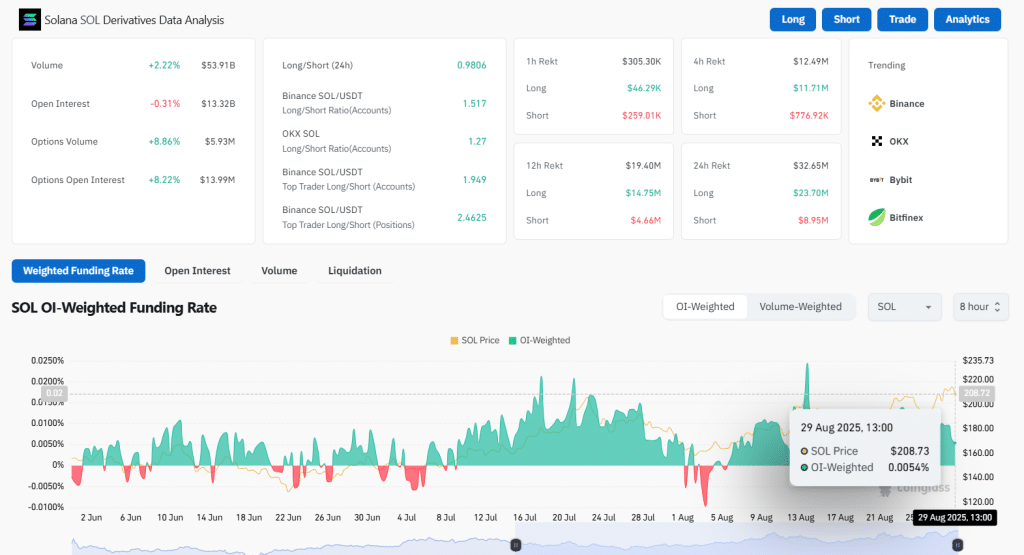
Source: CoinGlass
RSI and MACD Point to Sustained Bullish Momentum
The Relative Strength Index (RSI) stands at 58.88. Its moving average prints 56.15. This area indicates a neutral to bullish movement. RSI values above 55 show strength. A drop under 50 may signal the decline of demand. Market observers monitor the RSI to evaluate the direction of momentum.
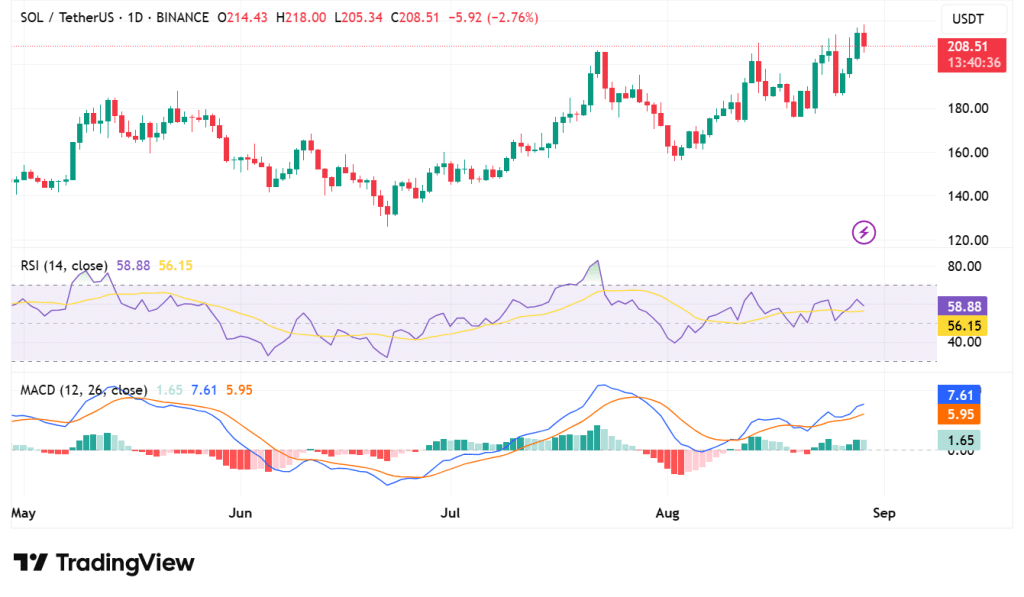
Source: TradingView
MACD indicates a bullish position. The MACD line at 7.61 sits above the signal line at 5.95. There is a positive histogram reading of 1.65. It shows that buying power is prevailing. The strength of the trend is confirmed by the green bars that are maintained. A turnaround here might be indicative of weakness.
Solana is at the edge of the winning position. Both RSI and MACD are on an upward trend. On-chain indicators show insight into indecisive sentiment, although interest is consistent. In the case of continued support by Solana, the road to $250 is open. In case of rejection, there will be a fallback to $185. As momentum is established, traders anticipate volatility.
Also Read: Bitcoin Infrastructure Acquisition Corp Launches $200M SPAC to Target Blockchain and Web3 Firms


