 Skip to content


- Solana’s price drops 0.23%, but a 36.45% increase in trading volume signals strong market engagement.
- A breakout above $212 could drive the price to $225, while rejection may push it back to $200 support.
- RSI at 44.73 shows neutrality, with MACD indicating slight bullish momentum and potential for market consolidation.
Solana (SOL) is currently trading at $206.67, a slight decrease of 0.23% in the previous 24 hours. However, despite this low-end price, the trading volume has registered a massive growth of 36.45%, climbing to $7.29 billion. This trading volume indicates significant investor engagement and active market dynamics.
In the last week, the price of SOL has gone down by 5.92%, reflecting a negative trend. The market is dynamic; the increased trading volume suggests potential future price movements, despite a recent decline.

Source: CoinMarketCap
Solana Nears $212 Resistance Level with Breakout Potential
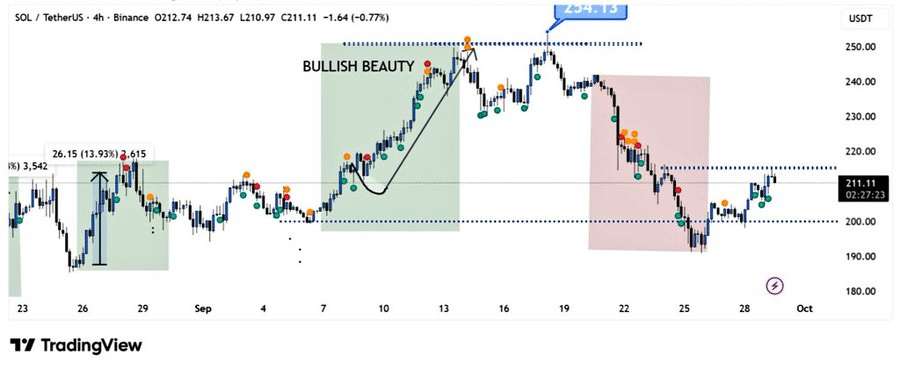
Analyst BitGuru highlighted that Solana is nearing the $212 price resistance after hitting the $200 price support. A breakout above $212 would drive the price to above $225. A rejection at this stage is likely to result in the price reverting to the support zone of $200. These are the major levels that analysts are observing to determine whether Solana will resume its positivity or pull back.
Source: X
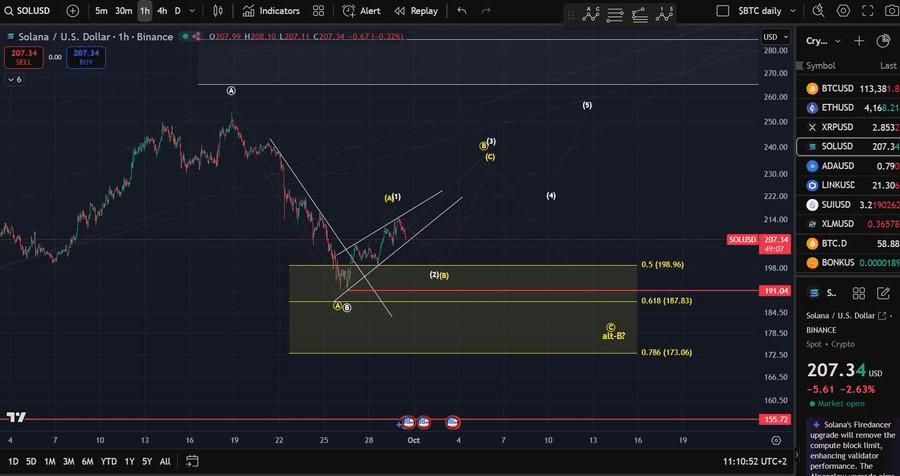
Moreover, another analyst, Man of Bitcoin, mentioned that the current price action in Solana appears to relate to a correction. He opines that once the price falls below the upward trendline, then this might be the start of a decadence. The price has the potential to decrease further, particularly if it falls below the $191 mark.
At this point, both optimistic and negative possibilities are conceivable. The direction in which the market moves will rely on how the price responds to these essential support and resistance levels. This development is closely watched by Investors in order to evaluate the next possible step of Solana.
Source: X
Also Read: WazirX Hits Legal Milestone After $234M Hack – What’s Next for the Exchange?
RSI at 44.73 and MACD Show Neutral to Slightly Bullish Outlook
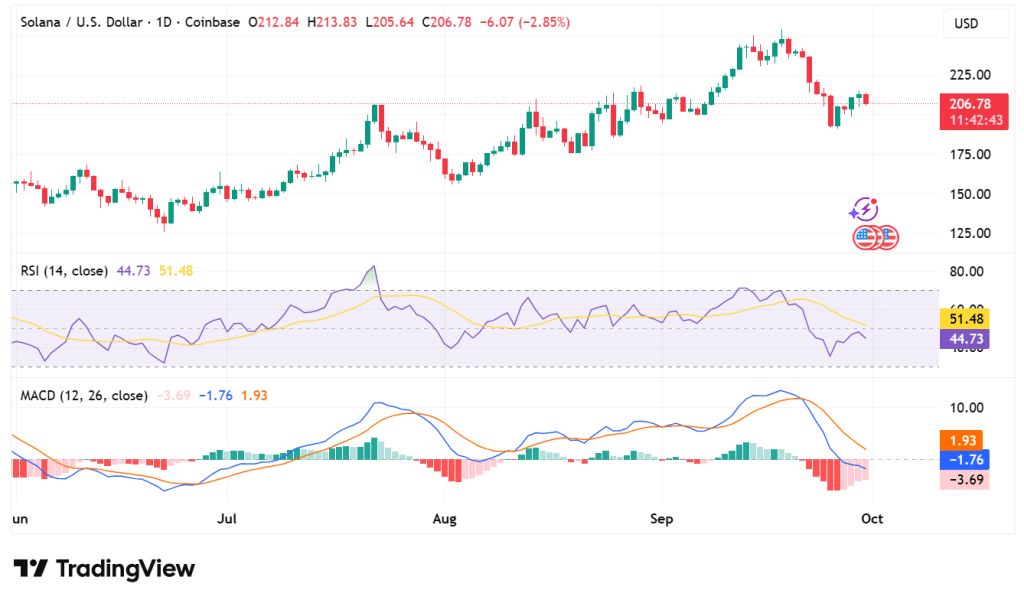
The Relative Strength Index (RSI) currently stands at 44.73, indicating a neutral market sentiment. Solana is neither overbought nor oversold right now. This indicates an equilibrium market; there might be a consolidation or breakout in the coming days.
The Moving Average Convergence Divergence (MACD) indicator is showing mixed signals. The MACD line is 1.93, and the signal line is -1.76. This shows slight bullishness, not extreme enough to establish an upward trend.
Source: TradingView
The price of Solana has short-term pressure, yet the increased trading volume is accompanied by mixed technical indicators, which suggest a vibrant market. Investors should remain attentive to key levels and market signals to anticipate potential price movements in the days ahead.
Also Read: XRP Skyrockets as 120 Million Tokens Bought in 72 Hours – What’s Next?


