 Skip to content


- Solana price holds at $214.23 after a 5.22% daily rise, with market volume jumping 155.63% to $7.63B.
- Analysts highlight $218–$220 as the next resistance zone, a breakout may confirm stronger bullish momentum.
- RSI at 59.63 and MACD levels signal room for growth, reinforcing optimism for Solana’s short-term trend.
Solana (SOL) is currently trading at $214.23, representing a 5.22% increase in the past 24 hours. The trading volume has increased by 155.63% and is currently at $7.63 billion, indicating a surge in activity. This indicates increased investor interest and market participation, which is a positive development.
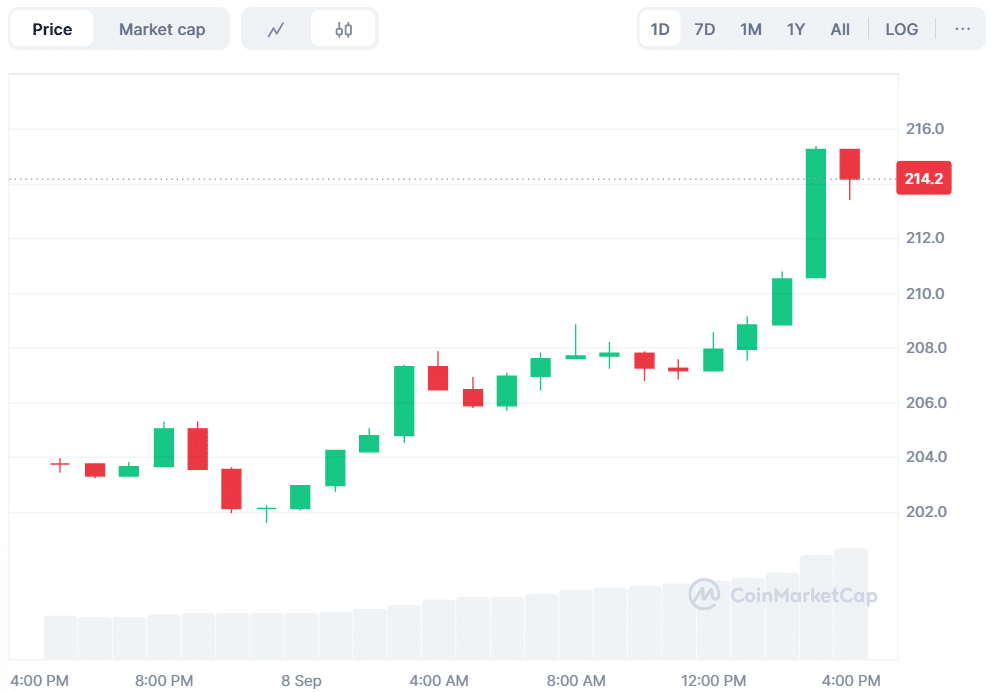
Source: CoinMarketCap
Over the past week, the price of Solana has increased by 7.6 percent, which strengthens the bullish trend. The steady increase reflects the strength of the coin and indicates that the optimism of traders and investors does not disappear.
Solana Targets Crucial $218–$220 Resistance Zone
More Crypto Online, a crypto analyst, highlighted that Solana has passed its initial resistance. The next target was between $218 and $220, as identified by analysts. The market might support even stronger momentum by breaking out above this range.
Analysts believe that this area is an essential indicator of the short-term trend of Solana. Any subsequent movement that occurs after and beyond this point could confirm additional bullish dominance. This level is regarded as critical for the subsequent phase of development.
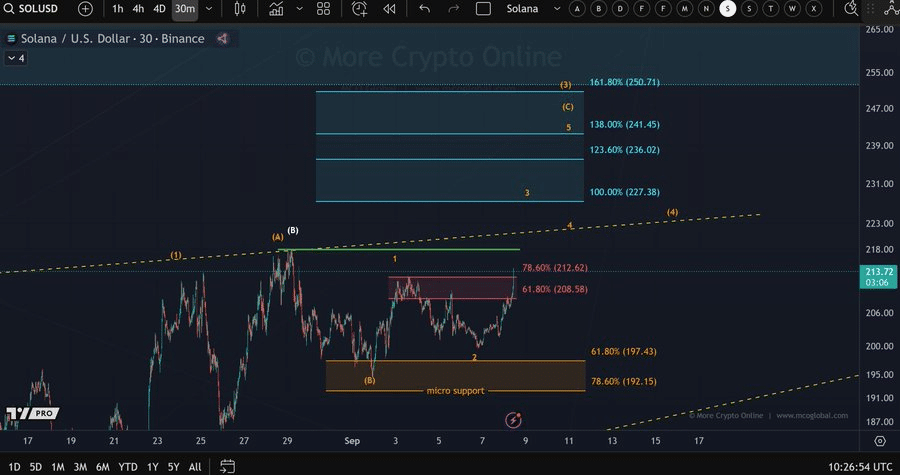
Source: X
Volume and Open Interest Point to Strength
CoinGlass data supports the positive outlook. Trading volume surged by 110.41 percent, reaching $20.37 billion. Open interest also rose by 8.26 percent to reach $14.01 billion. These numbers indicate increased participation in derivatives markets. SOL OI-weighted funding rate stands at 0.0089, indicating consistent leverage demand.
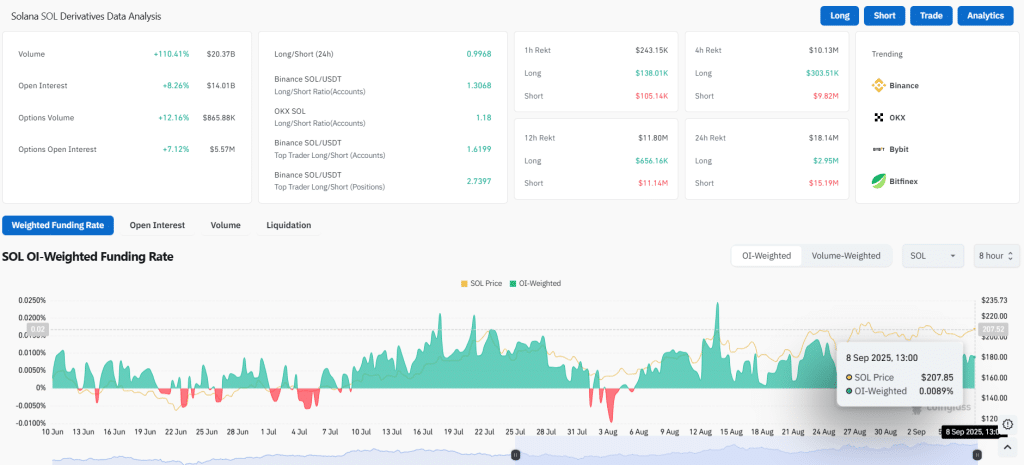
Source: CoinGlass
Also Read: Ethereum DeFi Shock: Kinto $K Token Hack Drains $1.55M and Crashes 95%
RSI and MACD Indicate Ongoing Bullish Momentum
The Relative Strength Index (RSI) stands at 59.63. This reading is still below 70, which is an overbought situation. The current position of the company indicates that buyers are actively involved; however, the upward trend has not yet reversed. This is seen as an indicator of a strong demand by market players.
The MACD trend renders additional understanding. The MACD line stands at 5.92 and the signal line at 6.00. The histogram indicates a small negative deviation of -0.08. The tightness of the alignment indicates that there can be a bullish crossover when the momentum continues to gain. This is a confirmation signal that traders are tracking.
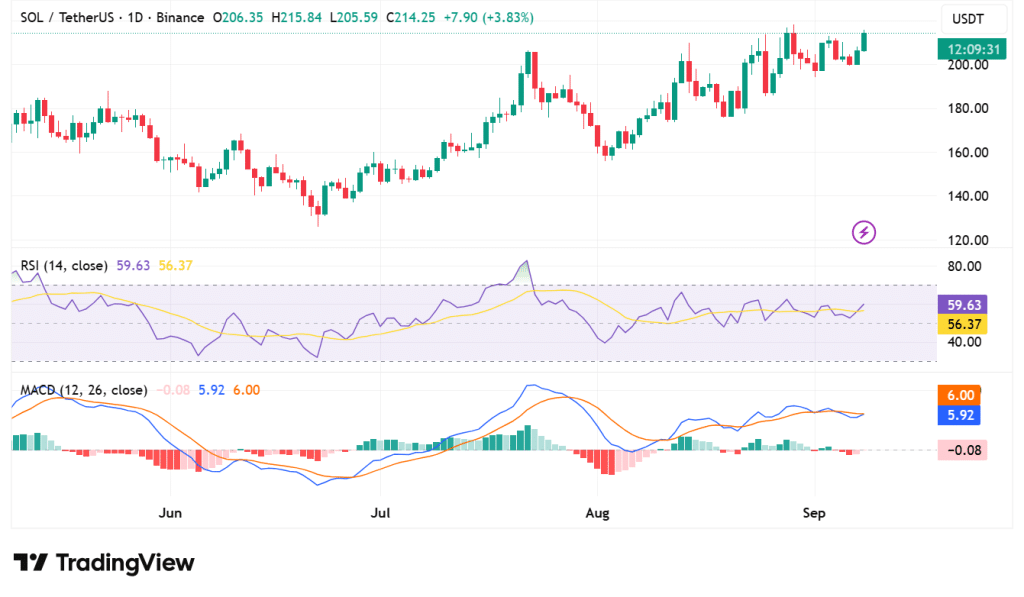
Source: TradingView
The broad outlook is that Solana is setting another resistance test. A high breakout above $220 may signal a way to higher levels in the short run. Both spot and derivatives markets data reinforce this opinion. As its momentum continues, Solana could become one of the most watched crypto assets.
Also Read: Metaplanet Expands Bitcoin Holdings to 20,136 BTC After Fresh Purchase


