 Skip to content


- XLM drops 0.48 percent, but a 23.9% rise in trading volume signals increasing market interest.
- A breakout from a descending triangle points to potential upside, with key targets at $0.45 and $0.52.
- RSI at 53.81 suggests neutral sentiment, leaving room for further growth if market conditions improve.
Stellar (XLM) is currently trading at $0.3926, decreased by 0.48% in the past 24 hours. However, trading volume soared 23.9%, up to $330.7 million. XLM has gone up 8.46% over the past week. This shows an increasing interest from the market, even if the price dropped slightly.
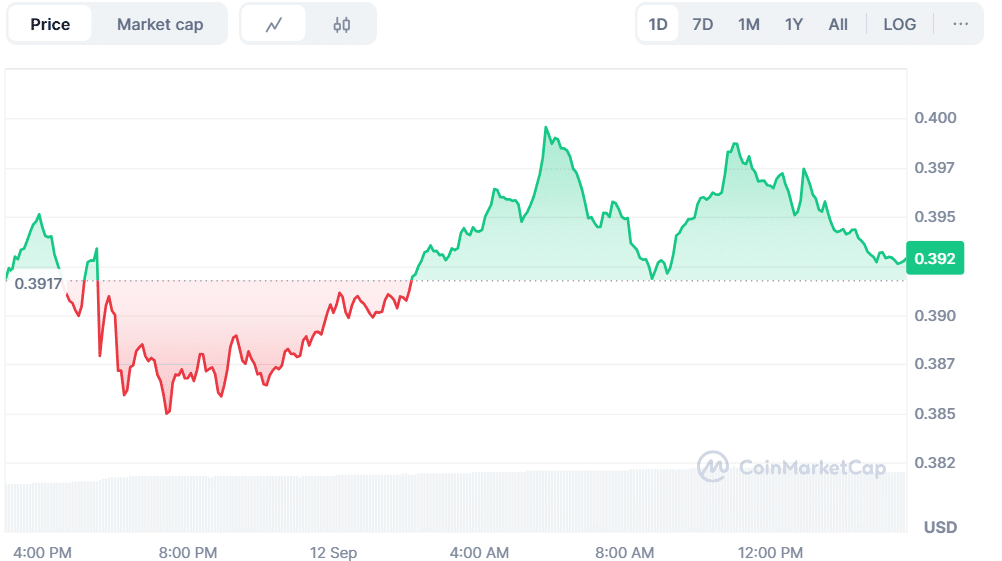
Source: CoinMarketCap
XLM Triangle Breakout Signals Bullish Move
Analyst CryptoPulse highlighted that XLM broke out of a descending triangle pattern, indicating more upside. The breakout is seen as a bullish thing; the would-be best entry point would have definitely been in the $0.37-DA $0.38 range. If the support holds, XLM may rise further with resistance levels at $0.45 and $0.52 in sight.
But if support does not hold, it could lead to retracing lower. In such a scenario, the price could slide back to the $0.36 level before another possible retest of higher levels. This potential retrace could give a favorable entry if the price consolidates.
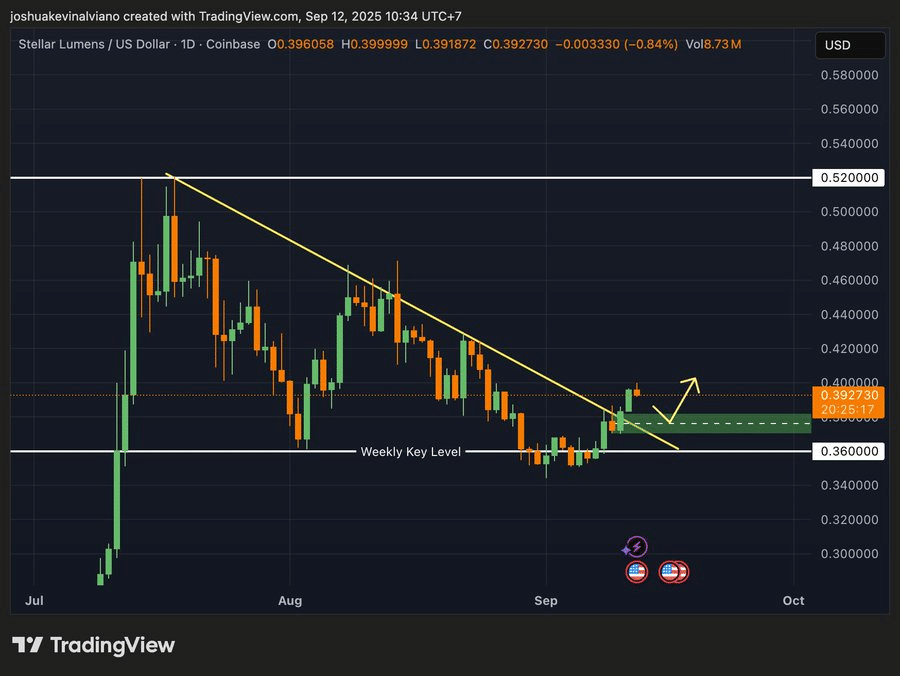
Source: X
Trading Activity Spikes with Rising Open Interest
According to CoinGlass data, open interest is up by 3.10%, with a total of $360.56 million. This increase in open interest is the indication that more traders are entering or going long in the market. Further, trading volume has increased 34.76 percent to $436.88 million. The XLM OI-weighted funding rate is at 0.0082%, indicating a neutral market sentiment following the recent price action.
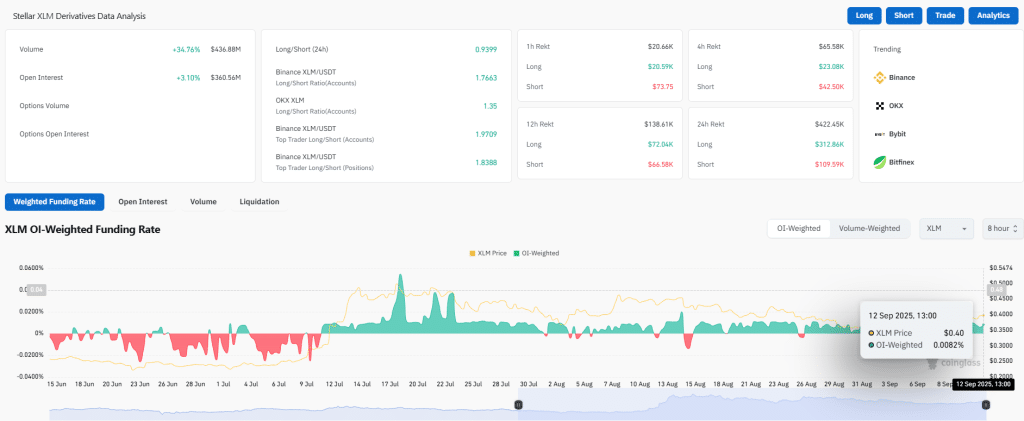
Source: CoinGlass
Also Read: SEC Chair Paul Atkins Shakes Up Crypto World with Bold New Support!
RSI and MACD Reflect Growing Bullish Strength
The RSI (Relative Strength Index) is 53.81. This demonstrates that XLM is not overbought or oversold on the daily time frame. The RSI is slightly above 50, so there is room for further upside momentum if the market situation allows it. An increase in RSI could be suggestive of additional strength for XLM.
The MACD indicator also confirms a bullish stance. The MACD line is 0.00489, while the signal line is at -0.004697. This indicates that bullish momentum is increasing. The momentum recording histogram also displays higher bullish movements, and XLM may continue to see price hikes in the short term.
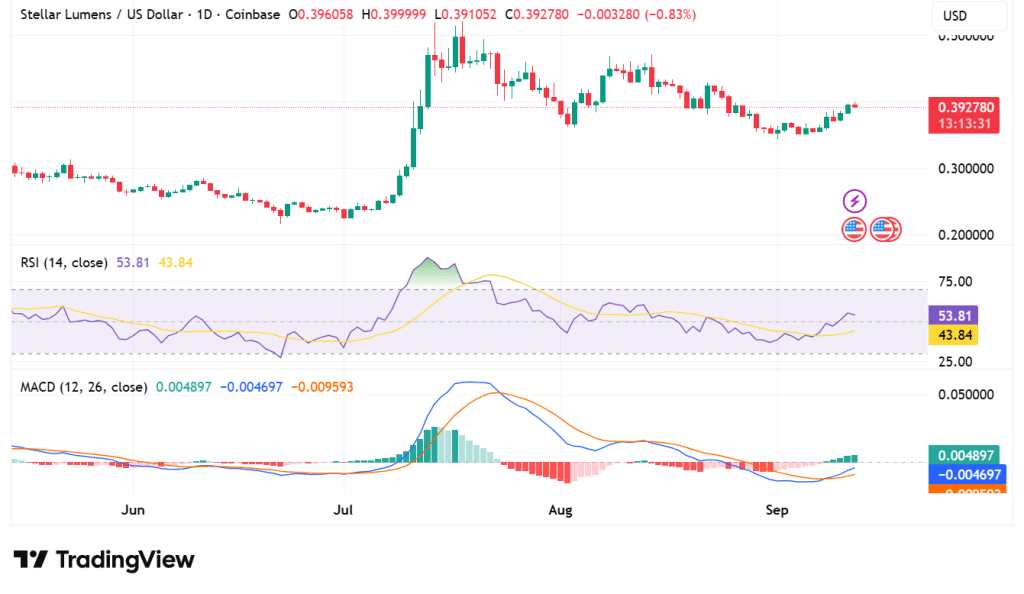
Source: TradingView
The technical signals from XLM indicate a combination of danger and presence. Although the price has retraced slightly, it still reflects the bullish bias indicated by the descending triangle break and rising volume.
Key support to watch is in the $0.37–$0.38 zone for traders. If XLM holds this support at a critical level, it could begin breaking toward the upside once again towards much higher targets such as $0.45 and $0.52.
Also Read: Hong Kong Eases Crypto Rules for Banks, Aiming to Become Global Crypto Hub!


