Skip to content


- Bitcoin shows strong demand near 60,000 and firm supply near 82,000.
- Options gamma explains why prices may stall or move fast at these levels.
- Strategy choice depends on whether price enters stabilizing or destabilizing zones.
This month, our research team released a report that introduced a custom heatmap from the Bitcoin Playbook. The goal was simple. We wanted to measure real supply and demand with precision. The model grouped key market pivots and volume clusters into clear price bands.
Blue zones marked support. Grey zones marked resistance. These zones highlighted where traders repeatedly showed interest and where liquidity often rested. Recent price action confirmed the model.
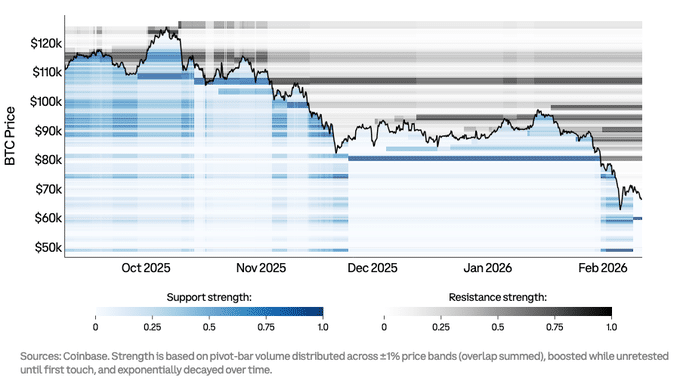
The strongest support cluster formed near 60,000. The first heavy resistance band emerged near 82,000. These levels now act as reference points for short-term structure. They show where price may pause, reverse, or accelerate.
Understanding Gamma Exposure in Trading
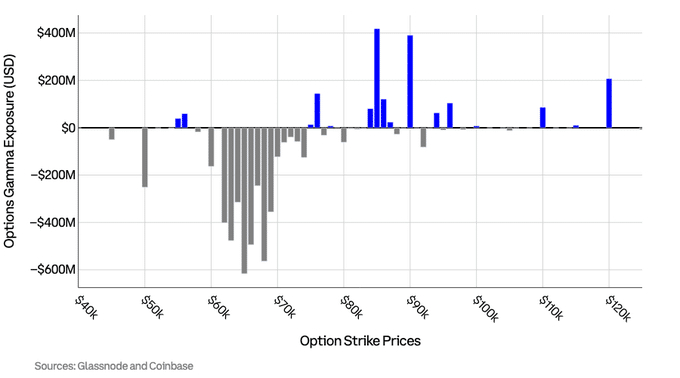
This week, the analysis adds gamma exposure as a second layer. Gamma exposure links the options market to spot price behavior. It shows how dealers hedge when prices move. This hedging can soften price swings or intensify them.
As a result, gamma helps traders decide between range trades and breakout trades. Gamma measures how fast option sensitivity changes as price moves. Dealers can sit long gamma or short gamma. Positioning depends on strikes and expiries. When dealers hold positive gamma and price rises, they sell to hedge.
When price falls, they buy. This action pushes price back toward balance. Positive gamma zones often reduce volatility. They promote consolidation. Prices tend to pin near large option strikes. Mean reversion strategies work better in this environment.
Traders often buy dips and sell rallies with more confidence. Negative gamma works differently. Dealers hedge in the same direction as price. They buy as price rises. They sell as price falls. This behavior fuels momentum. Small breaks can turn into sharp moves. Support and resistance lose reliability on first contact.
Bitcoin Key Levels and Gamma Zones Explained
When key price bands combine with gamma data, a clearer map appears. The area between 60,000 and 70,000 shows strong negative gamma. This raises the risk of fast downside moves. Above, pockets of positive gamma sit near 85,000 and 90,000.
These zones can slow upside progress. As a result, 82,000 stands as the main upside gate. A clean hold above it signals absorbed supply. That opens the path toward higher liquidity bands. Still, positive gamma overhead may cause choppy price action rather than a smooth rally.
On the downside, 60,000 acts as a critical shelf. A move into this zone may accelerate due to negative gamma. Overshoots remain possible. A bounce holds more weight only after price reclaims the level. If price rejects at 82,000, mean reversion may dominate.
Defined risk bearish option structures suit this setup. If price holds above 82,000, controlled bullish spreads may fit better due to chop risk. A sharp drop toward 60,000 calls for patience. Long exposure makes more sense after confirmation. Failure to reclaim 60,000 may signal a deeper regime shift. In that case, protective downside strategies can help manage risk in a fast market.
Also Read: Strategy Buys 592 BTC for $39M as Accumulation Drive Expands