 Skip to content


- Binance Coin slipped slightly in the past day, even as its trading activity rose sharply with higher market turnover.
- Analysts see a symmetrical triangle forming, with breakout targets at $962, $1,008, and $1,059.
- RSI at 53.04 shows neutrality, and MACD remains bearish, signaling indecision in market direction.
Binance Coin (BNB) is currently trading at $851.89. The coin is down 1.09% in the last 24 hours. Trading volume, however, has been on the rise. There was a 44.35% increase in volume, which is currently valued at $2.46 billion.
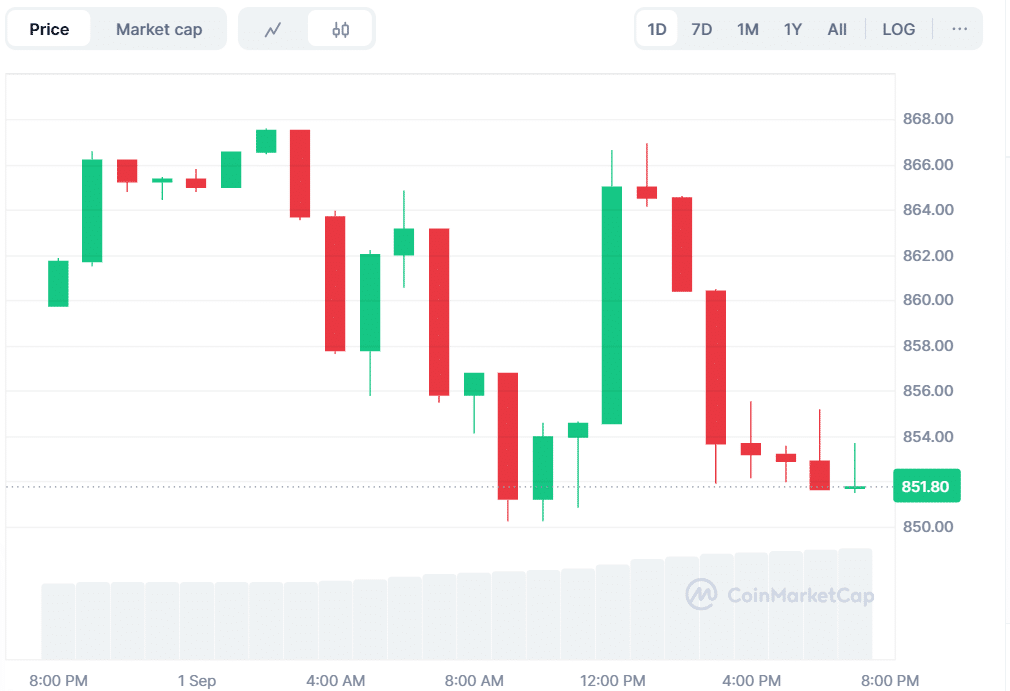
Source: CoinMarketCap
Over the past week, the coin has been experiencing a decline. BNB has experienced a weekly decline of 1.86%. This reveals short-term pressure on the asset despite increased market activity.
BNB Consolidation Points to Imminent Market Shift
Analyst Rose Premium Signals mentioned a symmetrical triangle structure that was forming on the BNB chart. The structure indicates a narrowing of price action and suggests that a breakout is looming. Analysts mentioned potential upside targets of $962, $1,008, and $1,059.
These levels can be considered critical resistance levels for the market. Traders are closely observing the pattern, waiting for a confirmation of direction. A break above these levels could determine the next major move for BNB.
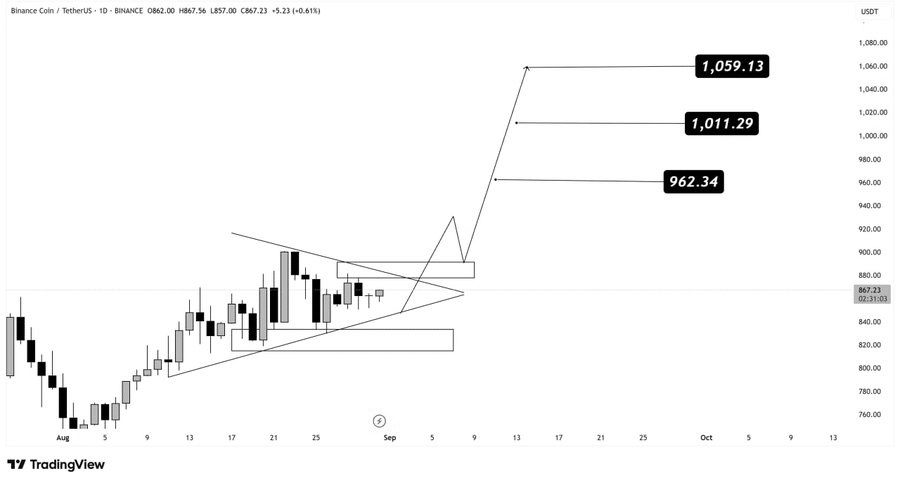
Source: X
Open Interest Falls as BNB Derivatives Volume Surges
CoinGlass data shows that open interest declined 1.21% to $1.42 billion, indicating lighter investor interest. Meanwhile, the trading volume of derivatives increased by 169.08% to $1.22 billion. The funding rate is flat at 0.0002%, and there is no obvious bullish or bearish dominance.
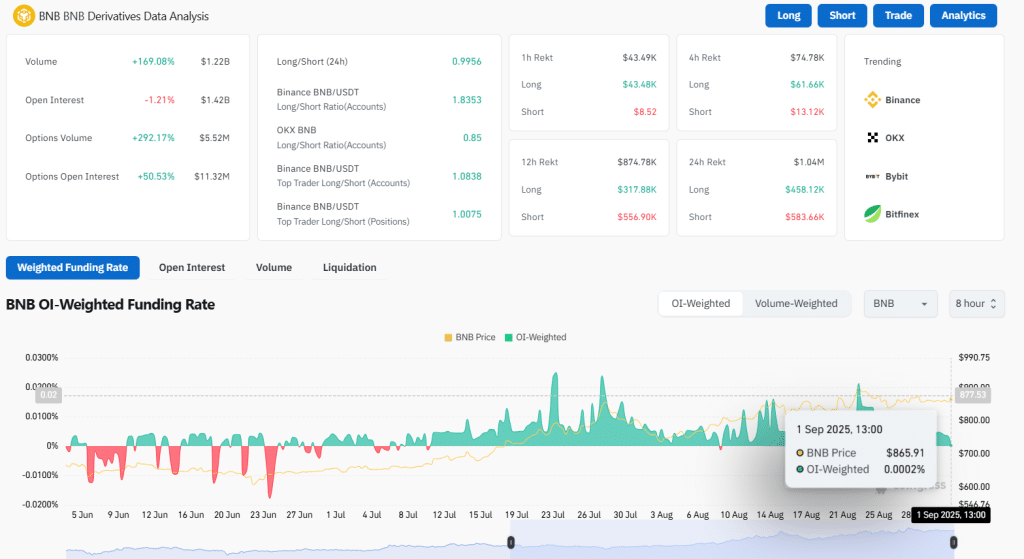
Source: CoinGlass
Also Read: SUI Price at $3.27: Will Rising Volume Spark a Breakout or Deeper Crash?
RSI Holds Neutral as MACD Shows Weak Downtrend
The RSI is at 53.04 with the signal line at 58.14. These readings maintain BNB in a neutral zone, suggesting that the market has not extended to either the upside or the downside. Bearish conviction can be strengthened by moving above 60.
The Moving Average Convergence Divergence (MACD) is slightly bearish. The MACD line is at 17.24, and the signal line is higher at 21.83. The histogram is -4.59, indicating poor downward momentum. Without a crossover, price action might continue to stay within its existing range.
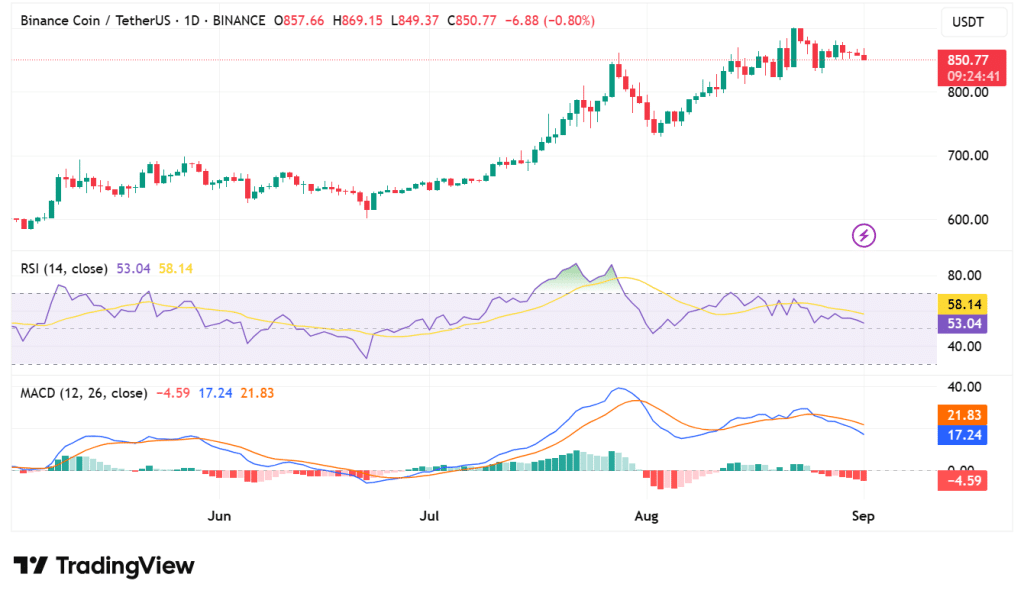
Source: TradingView
BNB’s outlook is one of balance of forces. The result is that increased trade indicates increased engagement, while technical readings indicate hesitation. The symmetrical triangle shows a pressure building that quite often results in meaningful movement. Traders are now waiting for confirmation as to whether the coin will go higher or further down.
Binance Coin is consolidating with mixed signals defining sentiment. The upside resistance levels are $962, $1,008, and $1,059. The token is likely to stay within its tightening formation until a clear breakout occurs. Traders are constantly watching out for changes that might shape the next trend.
Also Read: Bitcoin at $108K but Analysts Doubt Early Low Stability


