Skip to content


- Analyst says reclaiming $0.26 could trigger breakout toward $0.46
- Dogecoin tests critical support as double bottom setup gains attention
- RSI and Bollinger Bands suggest price reversal still in play
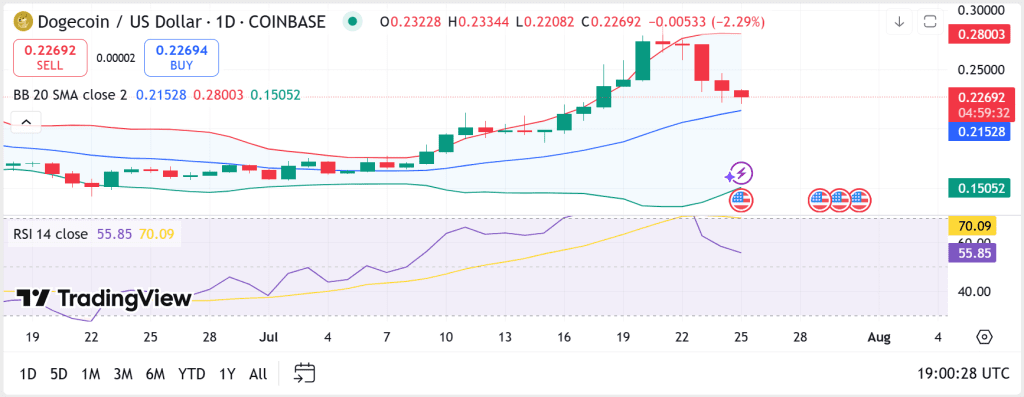
Dogecoin is attracting renewed market focus after experiencing a short-term correction from its recent highs. The cryptocurrency, which had previously shown strong upward momentum, is now trading at approximately $0.226. This level puts it just above a significant support zone that traders are closely watching for signs of a potential reversal.
Crypto analyst Ali believes that Dogecoin could be developing a double bottom pattern, which is a typical technical pattern that usually leads to massive bullish breakouts. In his analysis, he stated that breaking back to the $0.26 level as a support might be what spells further growth for the DOGE in reaching the $0.46 area. The structure creates a possibility of reversing steps, but as long as the current measures stand, and buyers take control.
Recent Coinbase trading prices depict that Dogecoin dropped by 2.29 percent in the past 24 hours, with intraday volatility of $0.220 and $0.233. Even with the decline, the recent consolidation seems to have happened beyond the mid-range support of the Bollinger Band, which adjusts to the range of the 20-day moving average at 215. This causes the area to be a critical point of fight where bulls seek to gain momentum back.
Also Read: JPMorgan Chase Plans to Offer Crypto-Backed Loans Amid Regulatory Shift
Support Zone at $0.215 Emerges as Crucial Battlefield for Bulls
Technical indicators also provide additional details about the continuing market’s behavior. The Relative Strength Index (RSI) has escaped into the overbought range and currently stands at 55.85. This reading is not bullish, but it has experienced moderate price action since it is still above the 50 level. This is an indicator to traders that the market has yet to enter bearish territory.
Bollinger Bands indicate that DOGE is now being tested at its dynamic support level. If this level is sustained and the price starts moving upwards, it would provide evidence of the bullish control and could draw the attention of traders looking at intentional breakouts. Conversely, the lack of maintaining support would create the path towards a fall below $0.18 or even less, losing the bullish stance at the given moment.
Now, traders are following the volume and price movement at the 0.26 figure. With a successful close above this level and very good confirmation signals, the pattern of dual bottoms would be confirmed, and it would mark DOGE on a course that is balanced to reach the bottom at the $0.30 level before rising toward the $0.46 forecasted by the analyst.
Dogecoin has reached a range that can be the key to the next significant breakout. According to the technical updates, trading above 0.215 and retaking 0.26 can unlock an impressive upside.
Also Read: Western Union Explores Stablecoin Integration After GENIUS Act Approval