Skip to content


- Ethereum struggles below $1,800 as sellers tighten grip and resistance zones hold firm.
- Technical indicators confirm rising bearish pressure with weakening support and declining trading volume.
- Failure to defend $1,743 could lead Ethereum price to plunge toward $1,710 or even $1,677 in early May.
In the final week of April, Ethereum showed a dramatic price downtrend, dropping it to $1,760 before a 3.06 percent market decline set in. The digital asset has been trapped below its essential resistant area, spanning from $1,800 to $1,825, for multiple days.
The price data from each day exhibited an uninterrupted sequence of decreasing peaks that proved the market kept a steady downward pressure through the entire week. Ethereum finished April 30 with a closing price of $1,771.80 because sellers kept applying pressure near essential resistance points.
Every technical indicator pointed toward a bearish trend and revealed no potential for short-term price upside in the market direction. The 4-hour MACD reached 4.89 as its signal line pushed up to 10.45.
The crossover pointed toward escalating selling activity since bears maintained continuous control of market movements. The decline in the Relative Strength Index reached 42.36, which provided evidence of investor demand deterioration.
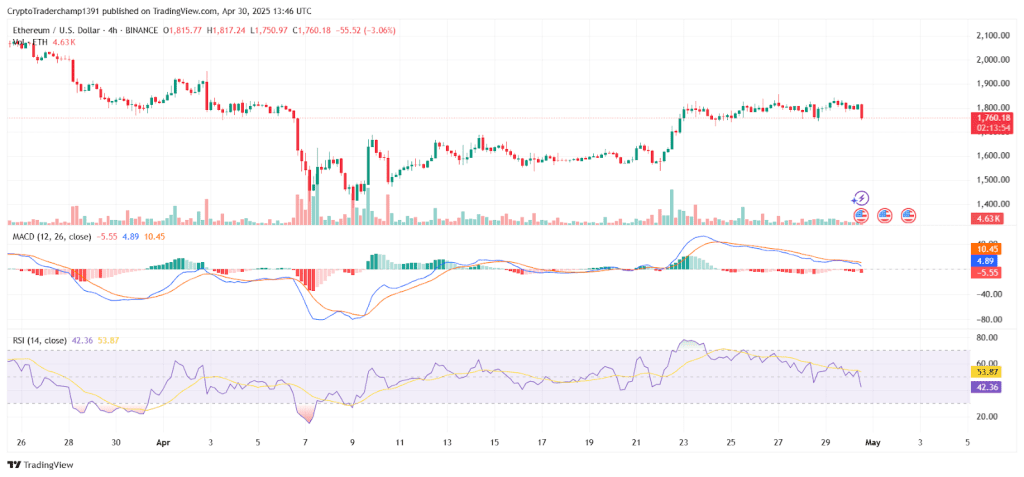
Market trading volumes decreased substantially, demonstrating waning interest levels among retail and institutional traders in new sessions. The trading volume registered on Binance dropped to 4.63K ETH during a four-hour period, which indicates minimal market interest.
The daily volume across DEX platforms hit $1.439 billion during this period instead of its typical levels. The data shows weak market interest with declining price figures, which suggests a growing possibility of additional price decreases.
Critical Support at $1,743 Faces Heavy Pressure Amid Weak Investor Sentiment
Ethereum maintained its position above $1,743, but this price corresponds exactly to the 50 percent Fibonacci retracement level. If the price drops below $1,743 support, then subsequent major support levels will be close to $1,710 and $1,677.
Downside acceleration seems probable once support at the current zone fails to maintain its position, particularly when bearish forces keep strengthening. Glassnode reports that $4.34 billion worth of capital entered the market during the last two weeks, with a 66.9 percent increase in flow.
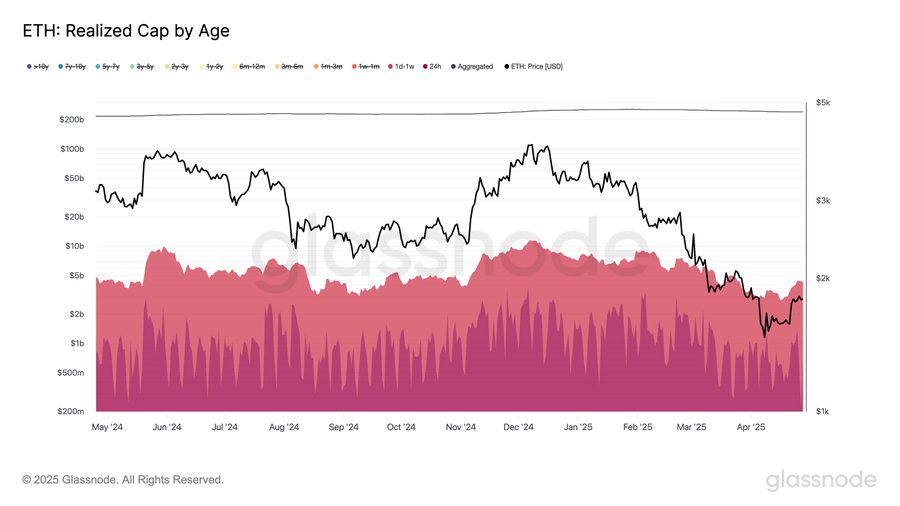
Most capital inflows originated from short-term holders, so moderate price declines would trigger their immediate market exits. The excessive speculative investments entering the Ethereum market system add additional instability and increase price volatility throughout all Ethereum trading zones.
Ethereum network activity reached its highest point in history during April while facing bearish price trends, creating optimistic projections for the long-term future. The Ethereum network registered its highest number of active addresses at 15.4 million, while Layer 2 transactions outnumbered Layer 1 transactions extensively.
The spot market demand stays weak because this prevents any possible positive network adoption reaction from taking effect. Ethereum’s price should continue to decline because an unambiguous break above $1,825 proves essential for overcoming present selling pressure.
Ethereum’s inability to maintain $1,743 as support will lead to decreasing prices toward $1,710 and possibly $1,677.
Also Read: Rising Uncertainty in Global Markets Drives Renewed Interest in Bitcoin and Gold