Skip to content


- XLM forms bullish pattern, mirroring XRP’s surge earlier this year.
- Breakout above $0.50 could send Stellar rallying toward $0.77.
- Failure at neckline may push XLM back to strong supports.
Stellar (XLM) is gaining attention as its chart shows a bullish setup similar to XRP’s rally earlier this year. The token has, however, created an inverse head-and-shoulder pattern according to crypto analyst Ali. The left shoulder, the head, and the right shoulder were shaped in January, late May, and since August, respectively.
XLM trade has currently hit $0.4454, a decrease of 2.07 percent over the last 24 hours. The price was at the neckline of $0.50, so even though the price had gone down, it was near the neckline. This neckline is viewed as a crucial degree of resistance. Should it sharply break out above it, it may lead to additional increases and even reflect what XRP did in the past.
In January this year, a similar pattern caused XRP to break out. That action caused an immediate double-digit rally, with owners taking a strong interest in purchasing shares. The above increases the hopes of the same outcome seen in the case of XLM due to the similarities between the two charts studied.
Also Read: Ethereum Foundation Sells $12.7M in ETH as Ether Hits Yearly Price Peak!
Breakout above $0.50 could target $0.71 and $0.77
Fibonacci extension analysis indicates where we might look for price points should XLM break through the neckline. The next level (1.618 extension) is approximately at the price of $0.71. The $0.77 is well below the 1.786 level, which gives reference points that traders can follow on a longer-term ascending rally.
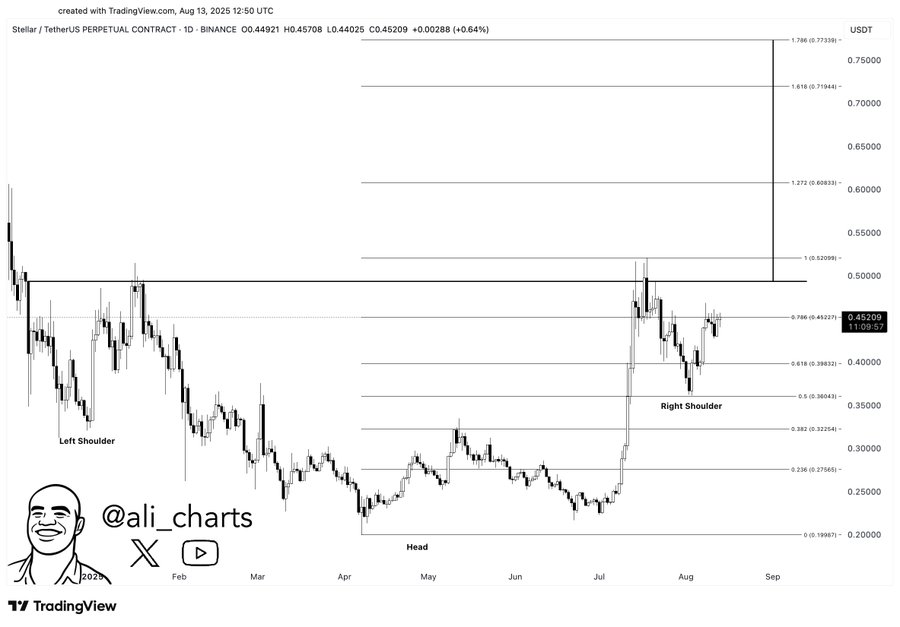
If there is no upward breakout through the half-century mark, it might backfire. The price may retreat to $0.36 or $0.40. These two levels have served as great support in past declines. They will once more stabilize the market before a renewed attempt at a rally.
Traders will be keen on a daily close above $0.50. This would substantiate the breakout pattern and further embolden the bullish phenomenon. Such an authentication can lead to the inflow of new buyers and will tend to increase the price to the expected Fibonacci levels.
XLM’s price action is crucial. A sustained breakout above the $0.50 mark might precondition the push towards the levels of 0$.71 and 0$.77. A failure to do this may trigger a retracement to the healthy supports before continuing higher.
Also Read: Bitcoin Platform Odin.fun Loses $7M in Massive Hack – Funds Drained!