Skip to content


- Litecoin nears a potential breakout as price action compresses within a symmetrical triangle pattern.
- A confirmed breakout above resistance could open the path toward $140, $180, and $285 targets.
- Tightening consolidation indicates rising volatility, with traders preparing for a sharp directional move.
Litecoin (LTC) is currently trading at $98.83, up 4.48% in the past 24 hours. The price has increased, but its trading volume has decreased by 6.58% and is now at $708.2 million. This increase in prices together with decreasing volume indicates cautious optimism from the traders, as lower participation is driving the gains recently.
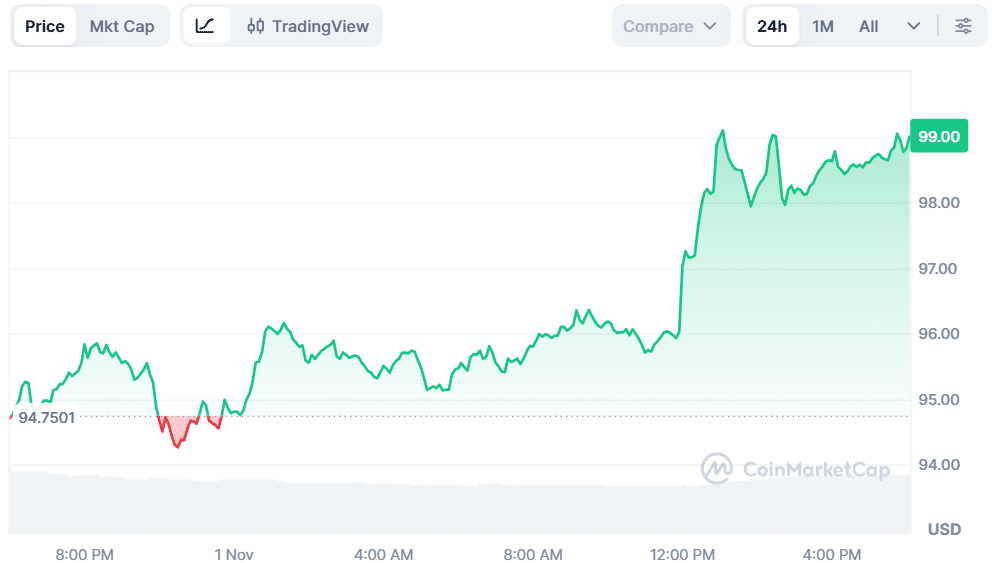
Source: CoinMarketCap
Over the last week, Litecoin’s value has increased by 2.92% with signs of steady upward growth. The steady rise is also a sign of growing market confidence and of renewed interest in buying the coin. However, the LTC seems to be entering a stable recovery phase now, backed by stable but positive market sentiment.
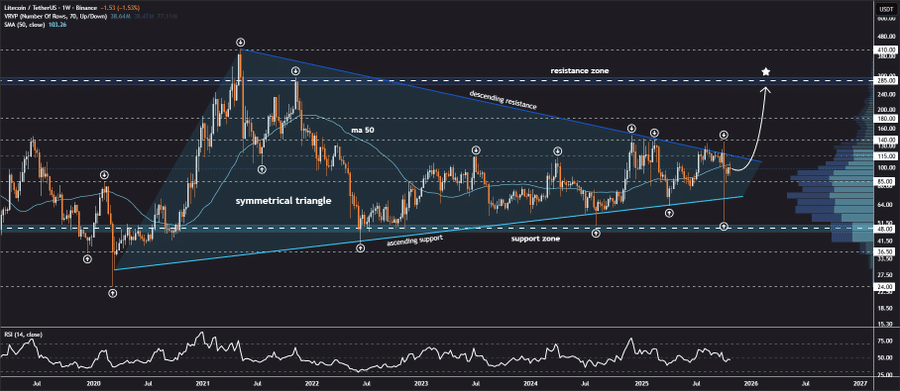
Litecoin Poised for Breakout as Symmetrical Triangle Tightens
A prominent analyst, Jonathan Carter, highlighted that Litecoin is playing in the upper part of its symmetrical triangle on the weekly chart, which is a key point of resistance for determining the next major move. He said a confirmed breakthrough above this range would generate a bullish wave towards $140, $180, and possibly $285, indicating that it could be a continuation of the upward momentum.
Source: X
The pattern of tightening price action is a condition that is quite common before sharp market volatility. The formation implies that market participants are piling up ahead of a breakout. With consolidation contracting, traders are keeping a close eye on this technical pattern, treating it as a potential launchpad for Litecoin’s next directional phase.
Also Read: Binance supports the AI16Z token rebrand to ELIZAOS
Open Interest Builds as LTC Tests Key Resistance Level
According to CoinGlass data, Litecoin’s trading volume was down by 21.90% and now stands at $740.65 million, with Open Interest (OI) increasing 4.05% to $456.56 million. The OI-Weighted Funding Rate of 0.0018% is neutral. These numbers suggest that the market is set up for a technical breakout but that it has not yet confirmed the move.
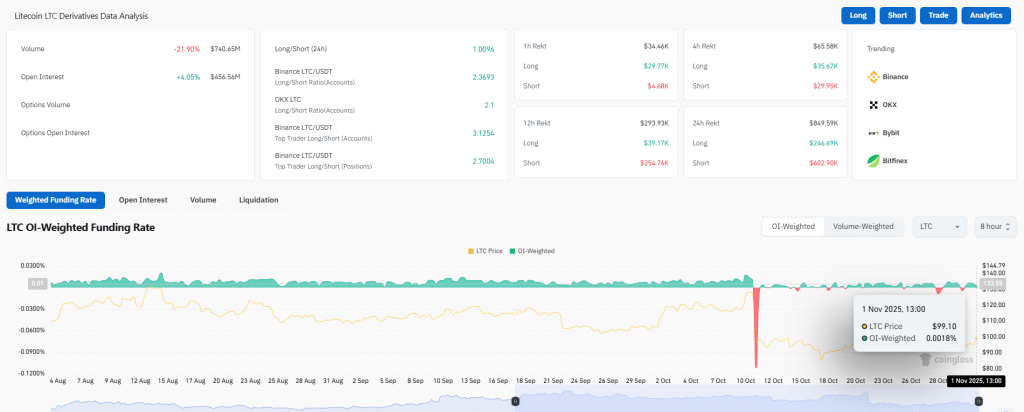
Source: CoinGlass
RSI and MACD Indicate Growing Bullish Momentum
The RSI is at 49.50, which is near the overbought and oversold middle ground. The RSI has been edging up from recent lows, indicating a strengthening of the buying power. However, a move above 55 would be required to confirm a stronger bullish move. Until then, momentum is moderate and in control.
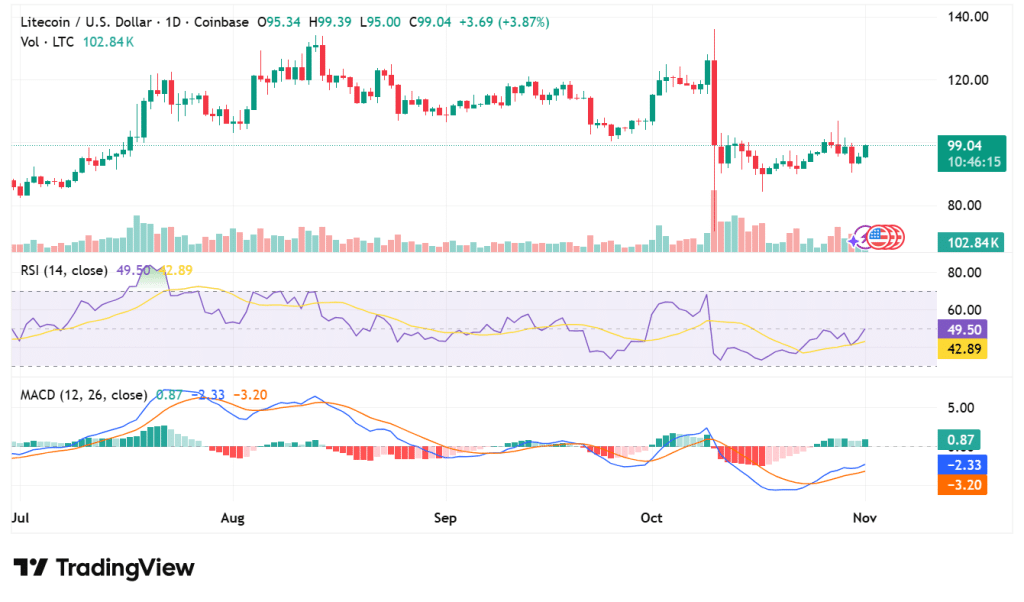
Source: TradingView
The Moving Average Convergence Divergence (MACD) indicator confirms this improving outlook. The MACD line is at 0.87, and the signal line is at -3.20, which is a bullish crossover. Green histogram bars appear, indicating a positive momentum.
However, the arrangement of LTC is a controlled optimism. Bullish sentiment is yet to be confirmed with the break above the $105 zone. Building strength is indicated by technical indicators with momentum falling in place for a possible breakout in the sessions to come.
Also Read: Solana ETFs Debut in the US: Grayscale and Bitwise Drive New Wave of Crypto Investments