Skip to content


- XRP price holds near $1.05 as traders watch $1.08 and $1.30 breakout levels ahead.
- Diana says a $1.30 breakout could flip resistance and confirm bullish continuation.
- EMA and MACD readings show XRP still faces overhead pressure despite recovery signs.
XRP price remained under pressure on Sunday, June 28, 2026, as traders looked for signs that buyers could sustain a recovery from key support. The token was moving toward major resistance levels that may shape its next direction.
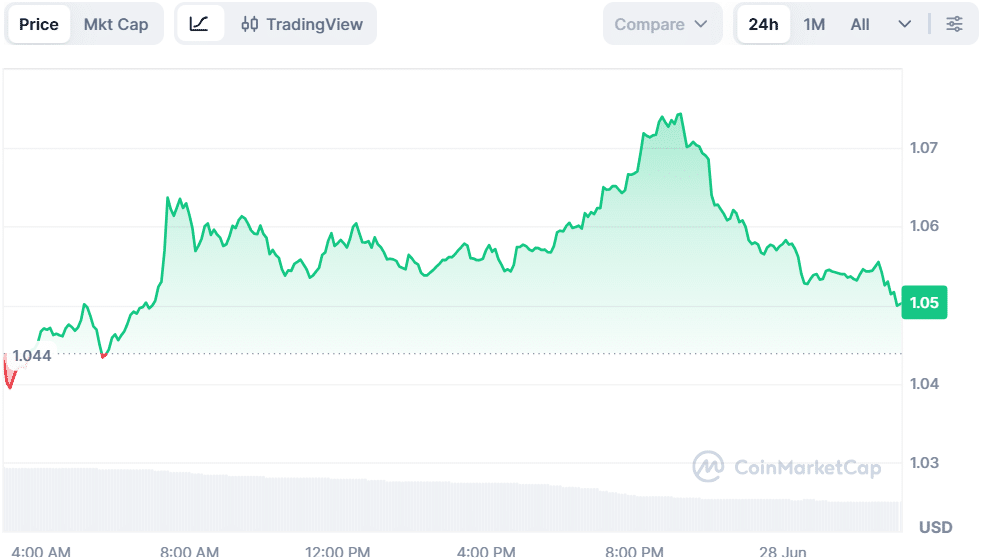
As of press time, XRP is trading at $1.05, up 1% in the past 24 hours. CoinMarketCap data shows trading volume stands at $1.19 billion, down 52.54% during the same period. The token has lost 8.56% over the last week.
Also Read: Sui Ecosystem Surges as Bluewater Acquires Suilend and Hashi Expands Alliance
XRP Price Must Clear $1.30 to Confirm Bullish Continuation
In a post on X, analyst Diana highlighted that XRP is trying to break the $1.08 and $1.30 barriers. She identified $1.08 as the first breakout confirmation level and $1.30 as the major resistance area.
She said $1.30 has rejected the recent rally. A move above that level could break the sequence of lower highs and flip resistance into support.
Diana noted that a decisive break above $1.30 could also push the price back above the Ichimoku Cloud. She said that move could confirm higher-timeframe bullish continuation if buyers defend the zone.
Elliott Wave projections mentioned by Diana now point toward a Wave 5 expansion. Those projections include a target near $8 if bulls protect the $1.30 area and maintain stronger buying pressure.
Additionally, another analyst, Ali Martinez, revealed that XRP is showing two bullish reversal signals on the daily chart. He noted that the Tom DeMark Sequential indicator printed a buy signal through a “9” candlestick.
Martinez also pointed to a Morning Star Doji pattern formed across the past three daily sessions. He noted that the structure can signal a local bottom when buying volume begins to rise.
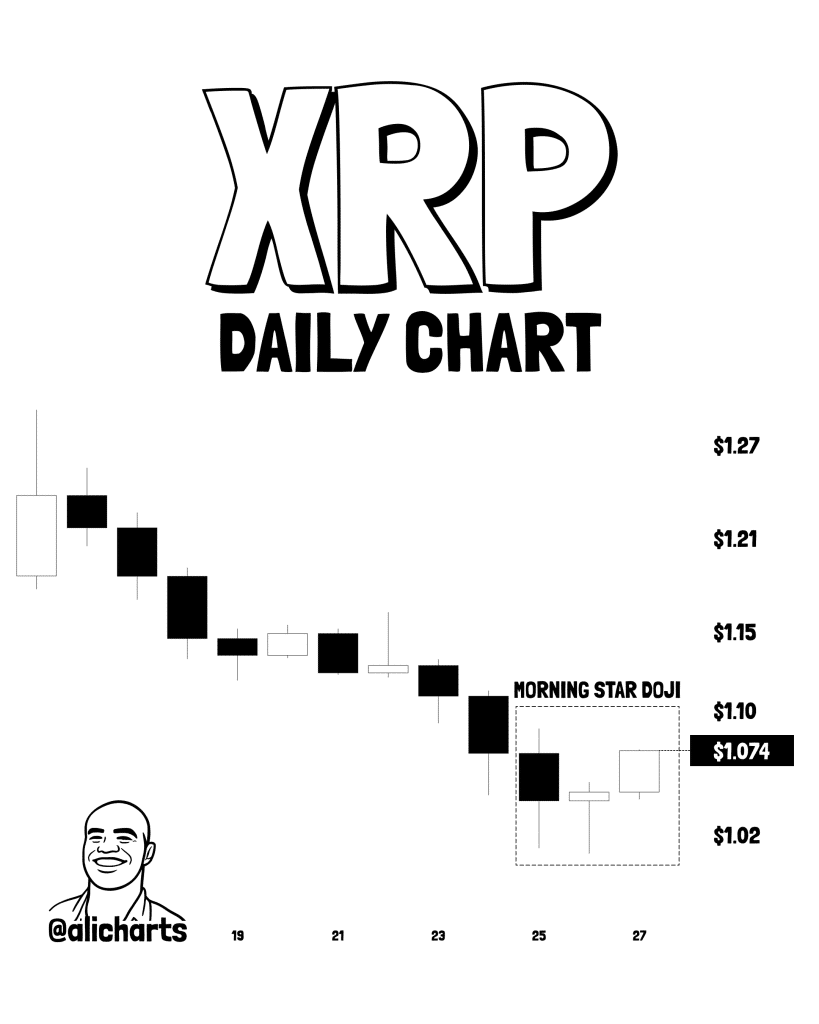
If volume improves, XRP could move toward $1.30. For now, the XRP price remains between early recovery signs and major resistance, with $1.08 and $1.30 acting as the main levels to watch.
Price Stays Below Key EMAs as MACD Remains Negative
According to TradingView data, the Exponential Moving Average (EMA) data show that short-term pressure remains active. The 20-day EMA stands at $1.13152, which is above the current XRP price. The 50-day EMA is placed at $1.21787, keeping the near-term trend below key averages.
The longer-term EMA structure also shows overhead resistance. The 100-day EMA stands at $1.32220, close to the $1.30 resistance zone. The 200-day EMA is at $1.53302, showing that the XRP price remains below its long-term average.
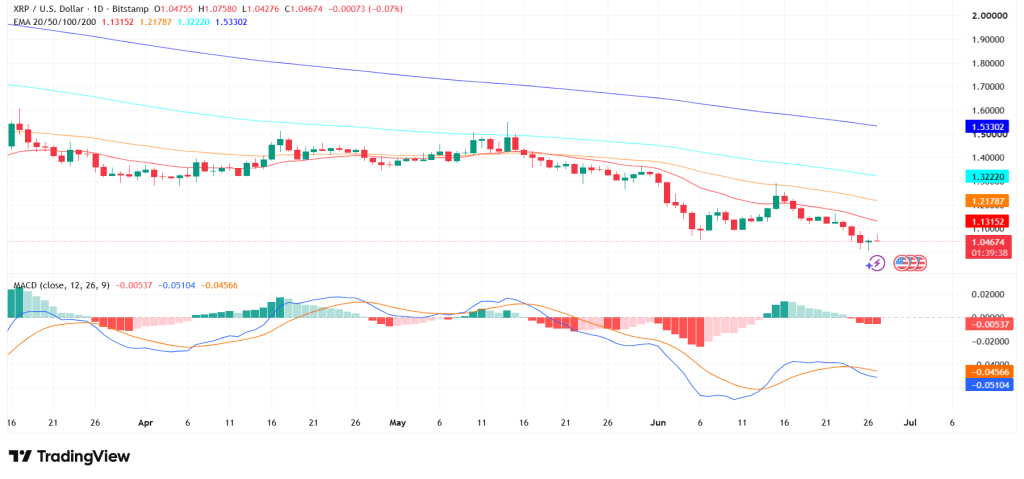
The MACD continues to show negative signals on the daily chart. MACD histogram stands at -0.00537, while the MACD line is at -0.05104. The signal line stands at -0.04566, keeping momentum below the neutral line.
Also Read: Strategy Buys 520 BTC as Cash Reserves Jump to $1.4 Billion