Skip to content


- Bitcoin bottom indicator flashes again as key accumulation zone approaches.
- Supply in Loss pattern mirrors previous cycle lows closely.
- CryptoQuant analyst highlights decade-long signal traders continue monitoring today.
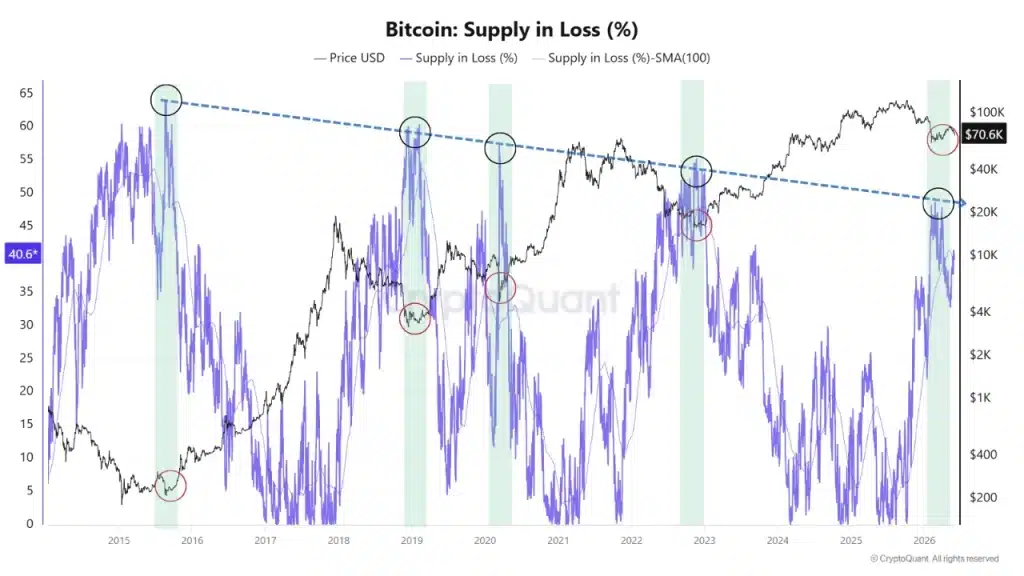
A Bitcoin indicator, which has proven to be near important bottoms for over 10 years, has recently fallen into a new zone of interest, according to CryptoQuant analyst MorenoDV. MorenoDV reports that the current Supply in Loss of bitcoin is 40.6% of its circulation. The figure is not a sign of peak capitulation yet, but the overall trend of the figure since 2015 has been associated with key cycles lows, the analyst said.
When analyzing all the bottoms of major bitcoins from the past ten years, MorenoDV has found that all have coincided with a break of the top of a downtrend channel marked by the number Supply in Loss. More important, at each new cycle, less and less investors had to be underwater for a bottom to be created. The early days bitcoin had market bottoms that occurred when over 60% of the bitcoin holders suffered losses that are not realized. In 2018, 2020 and 2022, however, it was clear that bottoms continued to drop, and they have continued to do so as we go.
Also Read: SEC Grants Paxos Authority to Clear and Settle Securities Trades
Declining Capitulation Levels Could Signal Market Maturity
In previous bear markets, only the ‘maximum amount of investor pain’ was required to create a meaningful bottom for Bitcoin, MorenoDV said, but that’s not the case this time. Rather, the downward trend line suggests a downward progression towards the high-40% realm, which puts the historical accumulation level much lower than 10 years ago.
The current price reading of the Bitcoin market is 40.6%, with stress already present, but the price is still in an area that has historically provided some of the best long-term investment opportunities in Bitcoin. It appears that if there’s more weakness or more consolidation, then Supply will possibly be returning towards the trend line in the vicinity of the Loss zone. If it does, Bitcoin will be in a space where he has encountered other big accumulation periods before.
Also, the metric offers some indications of investor behavior during times of uncertainty, and identifies potential market bottoms. This is where the rise in supply in loss can be mirrored by the decline in investor confidence of the short term investor and where the patient investor picks up the weak investor’s offerings.
Historic data shows there have been very few immediate recoveries in these environments. Instead, markets tend to have long periods of volatility, breakdowns which never seem to occur and exhausted emotions until a significant period of uptrend has begun to take shape.
Investors Watch Long-Term Trendline for Confirmation
MorenoDV noted that the indicator shouldn’t be taken as an absolute indicator of market bottoms. Yet one of the most followed and popular structures to follow within the decade-long trendline is a structure that relates to past cycle lows. As Bitcoin moves toward and into the high 40% mark, it will move closer and closer to some levels it has seen in past bear markets. As Bitcoin nears and enters the high 40%, the risk/reward may become more attractive to the long-term investors.
The Bitcoin Supply in Loss indicator has been following a trend that has been seen since 2015 following each down in Bitcoin’s major cycles. Although this 10-year indicator hasn’t yet reached the historical accumulation level, it’s definitely one of the biggest indicators to keep an eye on during the ongoing cycle.
Also Read: Coinbase Expands India Operations With New INR Payment Rails Launch